INTRODUCTION
Understanding the normal gait pattern is critical to evaluate the pathologic gait pattern and design the treatment plan. Accurate evaluation of gait is also important for preventing bone alignment deformation, muscle weakness and pain. For this purpose, gait has been studied for a long time in biomechanics and rehabilitation medicine using various noninvasive tools such as motion capture, force plates, electromyography (EMG) or other invasive tools.
EMG, in particular, has often been used to infer the force production pattern of skeletal muscle. However, it is important to be prudent in using EMG signal for the inference of muscle force during activity because some variables such as type of muscle fiber, muscle length, or muscle velocity are involved in the process of neuromuscular activity leading to mechanical response (Neumann, 2016; Roberts and Gabaldon, 2008). Roberts and Gabaldon (2008) also suggested that we should be cautious about the inference of force during activity from EMG, with showing the difference of force-EMG relationship between stance phase and swing phase of gait cycle.
A human body is structured with multilinked segments and connected by muscles which operate in a synergistic form in a motion. Therefore, the analysis of coordination and contribution of involved muscles during activity is essential for understanding the movement. For this practical approach, simulation using the human musculoskeletal model can be effectively used. This invasive tool, which has been remarkably developed with the advancements in computer science and simulation software, shows how muscles coordinate and contribute to support and propulsion during gait (Rajagopal et al., 2016).
In particular, utilization of OpenSim, the simulation software which was developed and provided as openware by Stanford University can bring about advancements in gait research, by calculating degrees of muscle activation and muscle force of individual muscles.
This study aims to analyze contribution of ankle muscles to support, resistance, and propulsion during normal gait by utilizing OpenSim for analysis of muscle activation and muscle force in healthy man.
MATERIALS AND METHODS
This study consists mainly of two stages. First, we conducted gait experiment with three-dimensional (3D) motion capture system (MotionAnalysis Corp., Santa Rosa, CA, USA) and force platform (AMTI Inc., Watertown, MA, USA) to produce gait data to be inserted into OpenSim. In the second stage, we analyzed dorsi flexor and plantar flexor of ankle joint through simulation after scaling gait experiment data gained from the experiment of previous stage to the musculoskeletal model provided by OpenSim.
Gait experiment and data collection
Cameras used this experiment were operated with a sampling frequency of 120 frames/sec, shutter speed of 1/1,000 sec. Force platform synchronized with motion capture system was set to 1,200 Hz for sampling rate, and gain value of 4,000 mV. Subject for experiment was a healthy male with height 171.4 cm and weight 69.7 kg. The subject was selected based on result of survey of body size provided by Korean Agency for Technology and Standards (2015). Physical features of the subject lied within ±1σ range of the standard figure. The subject was instructed to refrain from unusual activities such as drinking, excessive exercise, insufficient sleep, etc. And it was confirmed by interview at the day of experiment. The subject carried out self-selected normal walking practice for 5 min on barefoot at the experiment site to prevent abnormal walking due to psychological tension from a new environment. Collected data was analyzed by Cortex and OrthoTrak provided by Motion Analysis Corp. for analysis kinematic. Matlab was used for smoothing by cubic spline of curve fitting tool.
Simulation
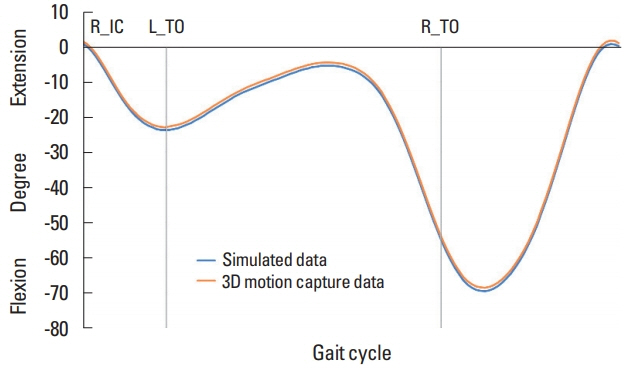
This study used OpenSim version 3.3 and Gait2392 musculoskeletal model. Gait2392 musculoskeletal model is a 3D computer simulation model for human which consists of 23 degree of freedom and 92 musculotendon actuators. We scaled data on subject’s weight, height, kinematic data, ground reaction forces, and moments that were collected from the gait experiment to Gait2392 model and constructed simulation model of subject. Based on criteria for successful scaling that is root mean square (RMS)=1 cm (Pineda, 2017), we concluded that the scaling was successful with the calculated RMS=0.014. We verified simulation model of subject by comparing calculated values using inverse kinematics function provided by OpenSim to right knee joint angle calculated from gait experiment data and the result is as shown in Fig. 1.
After applying residual reduction algorithm to dynamically synchronize kinematic values produced in simulation model of subject with measured ground reaction force and moments, computed muscle control (CMC) was used to simulate movements of muscles. CMC utilizes static optimization to distribute forces of synergistic muscles to each muscle and is used to produce forward dynamic simulation. This study selected a total of six muscles to be analyzed involved in flexion and extension of ankle joint: tibialis anterior (TA), extensor digitorum longus (EDL), extensor hallucis longus (EHL), gastrocnemius lateral head (GLH), gastrocnemius medial head (GMH), soleus (SOL).
RESULTS
Muscle activation and muscle force
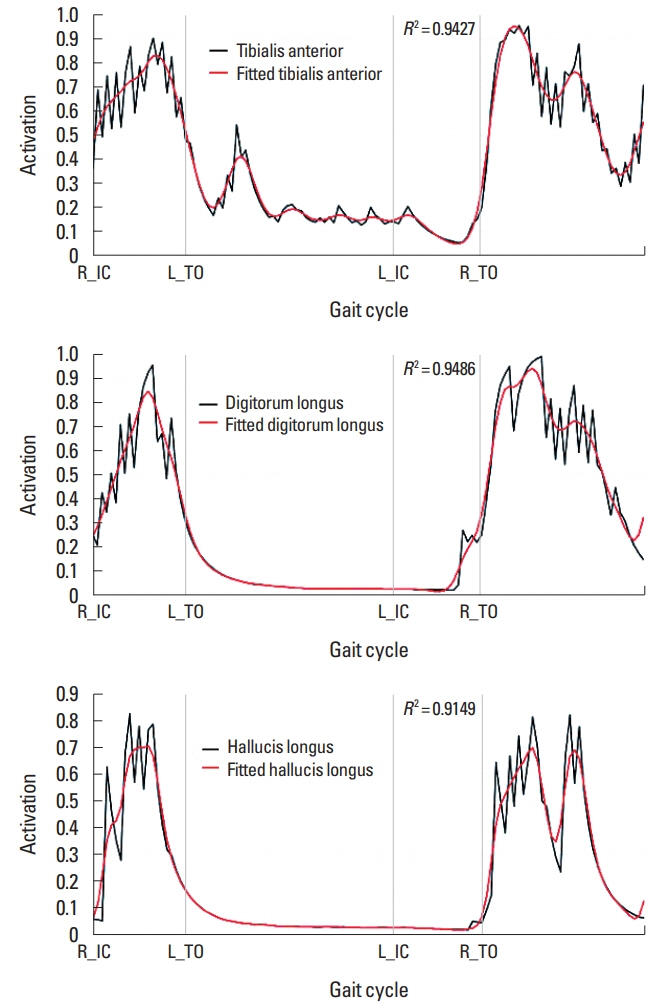
Fig. 2 shows activation change of TA, EDL, and EHL involved in dorsi flexion of right ankle joint. All three muscles demonstrated similar activation pattern that has peak value at initial support period and swing period and appeared to inactivate with lower 0.2 in a period of single support and terminal double support. The difference is that, in case of TA, the muscle was already activated at initial contact of right foot (R_IC) phase, while EDL and EHL were activated rapidly after R_IC phase.
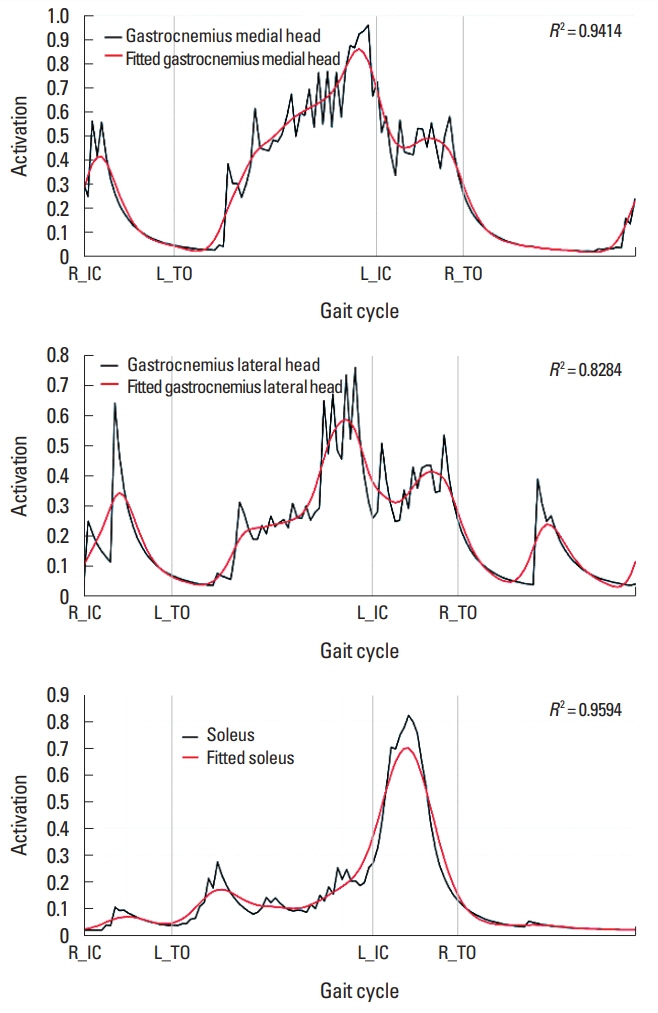
Fig. 3 shows activation change of GLH, GMH, and SOL involved in plantar flexion of right ankle joint. GLH and GMH showed similar activation pattern that increases the activation value in single support period. In case of SOL, activation showed peak value in terminal double support period. The muscles involved in dorsi flexion and plantar flexion of ankle showed high activation (maximum value is 1). SOL showed activation in terminal double support period, which is essentially a propulsion period during gait. Most notably, soleus showed the highest increase rate of activation.
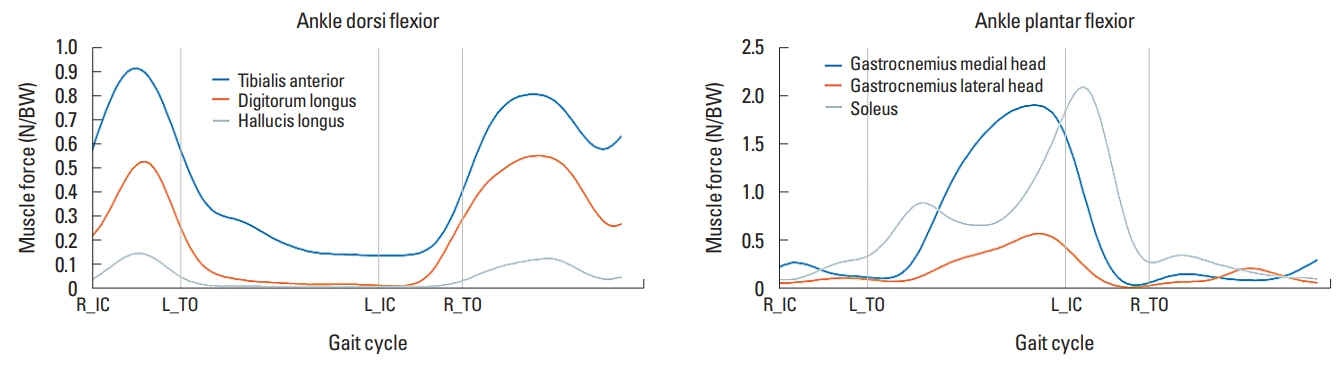
Fig. 4 shows forces of muscles involved in right ankle joint. Examining muscles involved in dorsi flexion of ankle joint, TA, EDL, and EHL all appeared to have the same change pattern despite the differences in forces generated. Therefore, these muscles appeared to be synergistic muscles that produce same effects during gait. In case of muscles of plantar flexor, GMH and SOL showed higher force than GLH from R_IC phase to toe-off of right foot (R_TO) phase. Particularly, muscle force of GMH and SOL was significantly higher with 2 times the body weight approximately than GLH at immediately before and after initial contact of left foot (L_IC) phase. The force change pattern was different from the activation change pattern.
Acceleration and ground reaction force
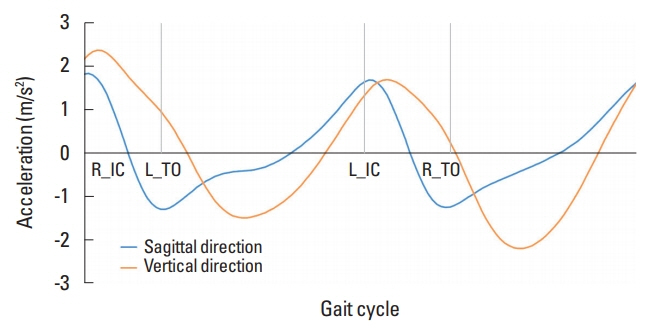
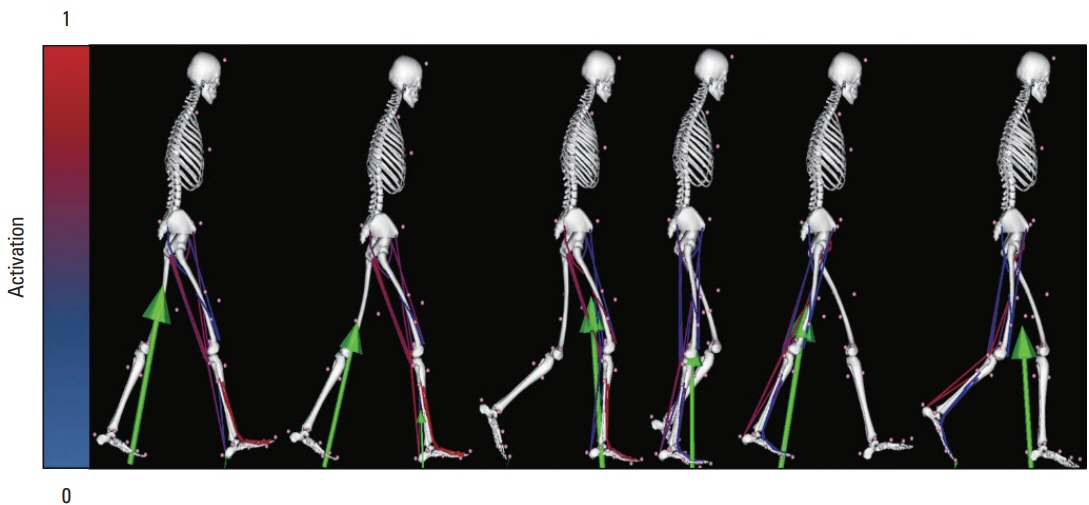
We investigated the contribution of muscles of ankle involved in propulsion, body support, and resistance based on center of mass (COM) and ground reaction force (GRF) according to gait cycle. The accelerations of COM in the forward and vertical direction are as shown in Fig. 5, and simulated muscle activation and GRF in each phase during gait is as shown in Fig. 6.
In the initial double support period where acceleration is decreasing, TA, EDL, and EHL showed relatively high activation than other muscles. Considering the direction of GRF is backward and upward, these muscles appeared to contribute to body support. In the single support period where walking speed is increasing, GMH and GLH showed relatively high activation than other muscles. Particularly, considering generated location and direction of GRF, GMH, GLH, and SOL appeared to contribute to the propulsion from middle point of single support period.
DISCUSSION
Support and propulsion are the main functions of the foot. It explains the role of ankle joint to move the body forward stably during walking. Therefore, it is important to analyze the activities of ankle joint muscles to understand normal gait. We conducted this analysis on the muscle activities of ankle joint using the human musculoskeletal simulation. Since muscle forces which generate human movements cannot be measured noninvasively (Pandy, 2001), human musculoskeletal simulation that quantifies the muscle forces indirectly can be useful and practical alternative.
In this study, the analysis of force change showed the activity pattern of ankle muscles according to the phase of gait cycle. In the force change pattern of dorsi flexor, there were two peaks at the period between R_IC and toe-off of left foot (L_TO) and after R_TO (Fig. 4). The first peak force seems to be made for smooth grounding of foot in initial contact and act as a resistive factor against forward progression of the body. The second peak-force shown in swing phase can be explained by dorsi flexion of ankle joint for bringing the foot forward.
The high activation (Fig. 3) and force (Fig. 4) of the plantar flexors between L_TO and R_TO shows the attribution to the muscles supporting the body and generating propulsion. The increased body acceleration and the size and direction of GRF indicate that the body is advancing forward in this period. GMH and SOL play an important role for the propulsion with generating higher force than GLH. This result is largely consistent with the previous studies on the function of the ankle joint (Anderson and Pandy, 2003; Blazkiewicz et al., 2017; Liu et al., 2006; Neptune et al., 2001).
The other noteworthy results of this study are as follows: We found that there could be a difference in muscle contribution between the results of analysis of activation and force. The peak-activation of the TA and EDL was similarly shown to be around 0.8 at the initial double stance, but the peak-force produced by these muscles in the same period showed a difference with 0.4 N/BW higher in TA than in EDL. The peak-activation of GMH was the highest among the analyzed plantar flexors, but the highest force was generated by SOL. In relation to this result, Arnold and Delp (2011), in a study regarding muscle fiber length, force, and muscle activation of lower extremity, reported that the length of muscle fiber is determined by joint angle and moment arm of muscles in case of low musculotendon compliance, and more dependent on the muscle activation and force-length-velocity effects in case of high musculotendon compliance. This suggests that the level of activation does not necessarily coincide with the magnitude of the generation of force. Given that human movements are made by the mechanical net force of muscles, it is more reasonable to analyze the contributions of muscles based on the forces rather than on the activation of the muscles.
The second, GMH and SOL, which play an important role in promoting the body forward, take turns showing peak-force near the L_IC point (Fig. 4). In the second half of the single stance period, the force of SOL begins to rise just before GMH reaches the peak force, and SOL shows a peak force when GMH starts to decrease rapidly after the peak. When GMH and SOL are analyzed separately, GMH mainly contributes to support and promotion of the body during a single stance period, while SOL primarily contributes to propulsion in the L_IC. Given that the peaks of GMH and SOL appear in a series almost simultaneously, it appears that GMH and SOL cooperate to sustain propulsion for a longer time. This activity pattern of GMH and SOL is effective to move the body forward against the resistance caused by initial contact of opposite foot. The coordination between GMH and SOL, along with the action of individual muscles, can be considered as an efficient forward driver of normal walking.
Based on the results of this normal gait study, more accurate and multifaceted evaluations of gait at various clinical sites will be able to be made using simulation techniques.