INTRODUCTION
The number of people suffering from low back pain (LBP), including spinal disorders and herniated intervertebral discs, has increased every year. Several researchers reported that LBP is related to bad posture and deformation of the spinal alignment, excluding those with native vertebral disorders. Spinal malalignment is a deformity of normal spinal alignment, including lordosis, kyphosis, scoliosis, forward head posture, and pelvic torsion (Kingma and van Dieën, 2009; Meakin et al., 2008). The alignment of the pelvis and lumbar vertebrae affects other parts of the body, and it is likely to cause further health problems or complications. Alterations in the curvatures of the lumbar and/or thoracic vertebrae affect postural changes of the neck and head. The vertebrae comprise an articular chain, where changes in one part of the column create biomechanical interactions that affect the alignment by creating compensations in adjacent vertebrae (LeVeau and Bernhardt, 1984). Control of posture and balance of the body is a process of complex interactions of various tissues in the body and forces generated from outside. The spinal column is an essential element to maintain normal balance (Shumway-Cook and Woollacott, 2000). Maintaining correct posture is important because it affects the functional efficiency of the musculoskeletal system and the body as a whole. When the curvature of the vertebra occurs, the cervical, thoracic, lumbar, and sacral joints develop organically in the upright posture by imposing elasticity against compression pressure. That is, when a joint’s function deteriorates, it compensates to maintain balance in the sagittal plane at other sites. If this condition persists, changes in the musculoskeletal pattern cause pain or other clinical problems (Nault et al., 2002).
In spinal diseases, pain is a major symptom and an important target for treatment. In terms of treatment outcomes, pain is an important measure for determining effectiveness. Correctly measuring pain in patients with LBP is important for evaluating the outcomes of the treatment of LBP and for comparing the results between treatment methods. Because LBP is subjective, it is impossible to accurately measure pain levels because of conditions such as physical, psychological, emotional, or environmental states. Despite the fact that we have developed many methods to quantify pain, reliability is debatable, and there is no way to fully measure the characteristics of the paraspinal muscles in the context of LBP.
The erector spinae are the most important paraspinal muscles for supporting the spine. They are a group of muscles and tendons that run more or less the length of the spine bilaterally from the sacral region and hips to the base of the skull. The muscle fibers are oriented differently in various segments of the muscle chain. Bogduk et al. (1992) reported that the fibers of the lumbar erector spinae are oriented more obliquely to the long axis in the back than in the thoracic portions. The lumbar part of the erector spinae muscles exerts shear forces on the upper lumbar levels (Bogduk, 1980), and this mechanical adaptation might enhance muscle endurance; the muscles fatigue differently depending on the segment in question.
A static functional test of the erector spinae of patients with LBP is recommended when a dynamic functional test is not possible because of moderate-to-severe LBP. Many noninvasive diagnostic methods have been developed based on imaging and electromagnetics. Ultrasound, magnetic resonance imaging, and electromyography are commonly used. Surface electromyography, sonomyography, mechanomyography, myotonometry, and tensiomyography (TMG) are all used to evaluate muscle function (Ballyns et al., 2011). Because TMG can transmit data through mechanical signals, it is less sensitive to external noise, is not affected by skin resistance or sweating, and does not require much proficiency. TMG is used as a static function test; however, it is rarely used in patients with LBP. The categories of normal or abnormal waves are not been defined. Because TMG is noninvasive, easy to apply to specific muscles, and involves a simple indicator, it can be used to understand changes in muscle function. Because there is little known measurement method for LBP using by TMG, this present study aimed to inform what the usefulness of TMG is and if TMG is useful in clinical diagnosis by detecting the characteristics of the erector spinae of LBP patients.
TENSIOMYOGRAPHY AND MUSCLE CONTRACTILE PROPERTIES
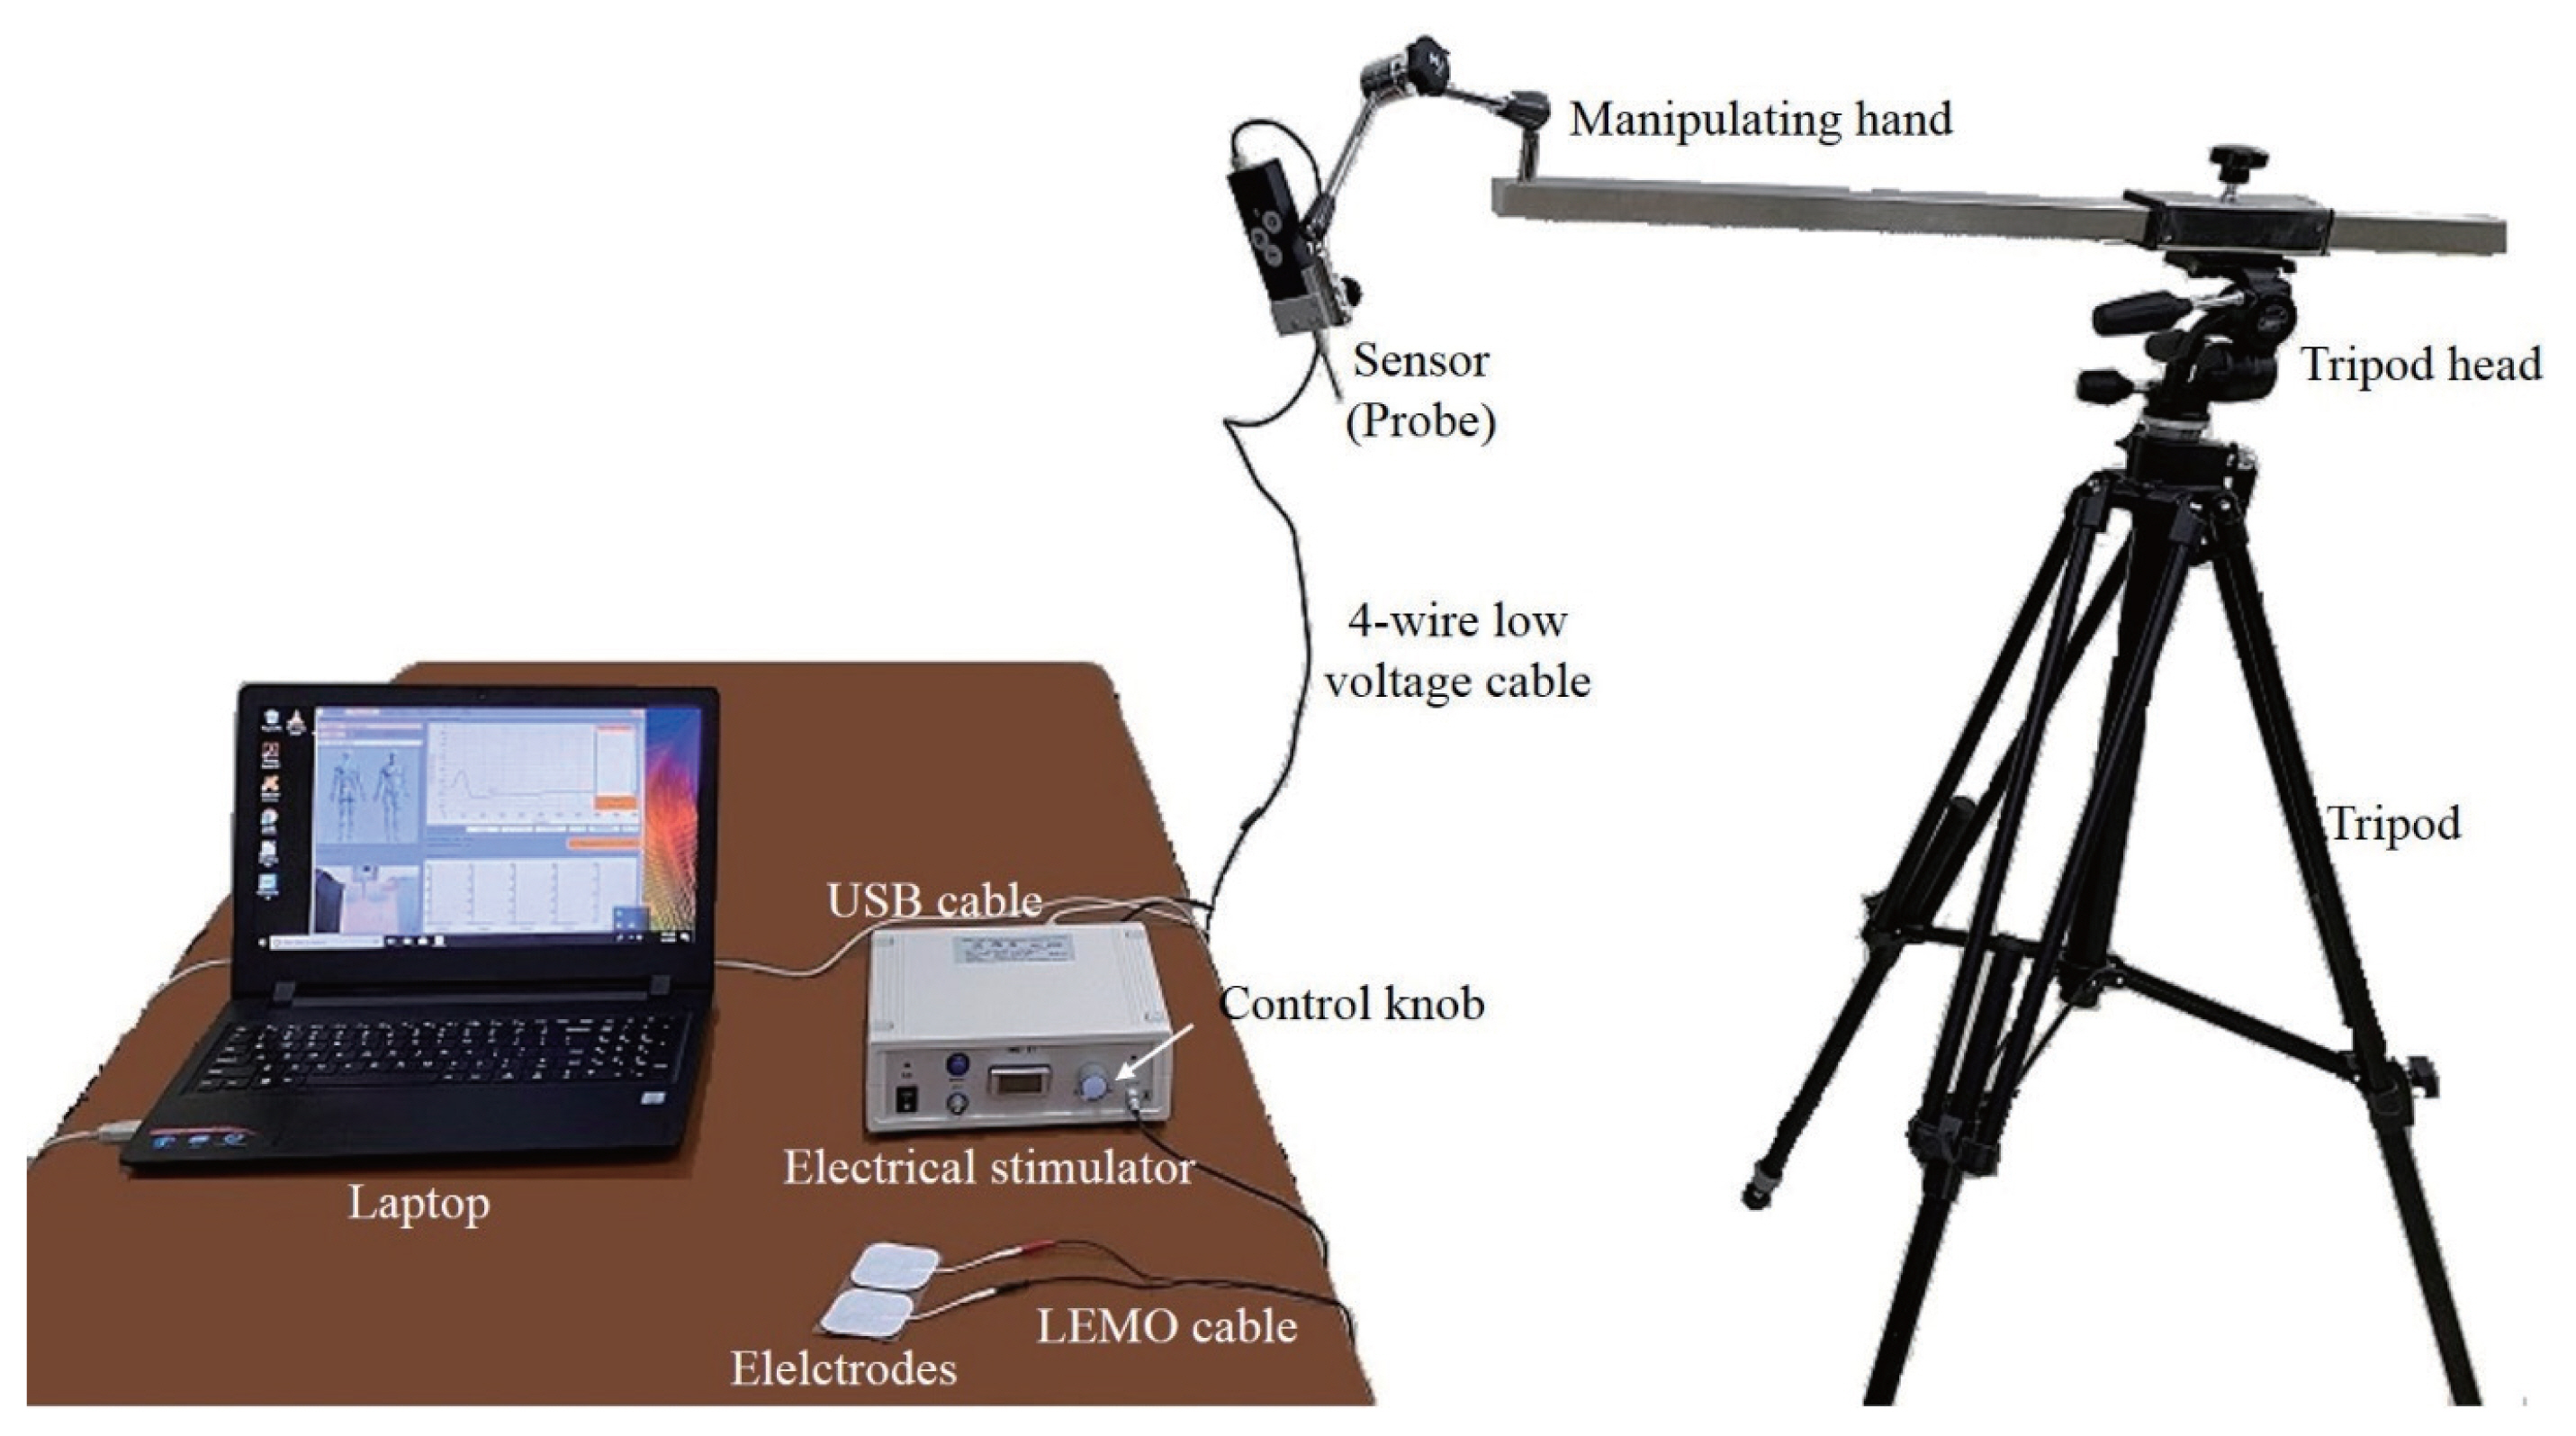
TMG measures contractile properties of muscles (Dahmane et al., 2001). It assesses mechanical responses based on radial muscle belly displacement induced by a single electrical stimulus (Tous-Fajardo et al., 2010). It is performed using a TMG device (TMG, TMG100, TMG-BMC Ltd., Ljubljana, Slovenia). This instrument includes an electrical stimulator and a data acquisition subunit, a sensor (probe), electrodes, electrical stimulator, and a tripod with a manipulating hand that works with a software interface installed on a laptop (Fig. 1) (Dahmane et al., 2001).
TMG has been used in exercise rehabilitation, sports medicine, and clinical research. Its data can be used to determine muscle fiber type (e.g., by comparing displacement signal and muscle histochemistry/amounts of myosin heavy chain) and muscle status/condition (fatigue, potentiation, inhibition, and stress). It can also be used to diagnose functional muscular symmetry, either temporal or morphological, to evaluate muscular synchronization and for fast detection (less than 5 min) of infra-clinical lesions in muscles (Dahmane et al., 2005; García-Manso et al., 2011; Rusu et al., 2013).
MEASUREMENT STEPS AND RECORDING OF TENSIOMYOGRAPHY
A special sensor is placed on the muscle to be measured. The sensor contains a tip designed to register muscle contraction. Muscle contraction is induced with twitch type (1 msec) of surface electrical stimulus. Contraction of muscle under isometric conditions results in muscle belly displacement. A TMG sensor is connected to a computer running software that records displacement of the sensor tip during the test and displays results in real time.
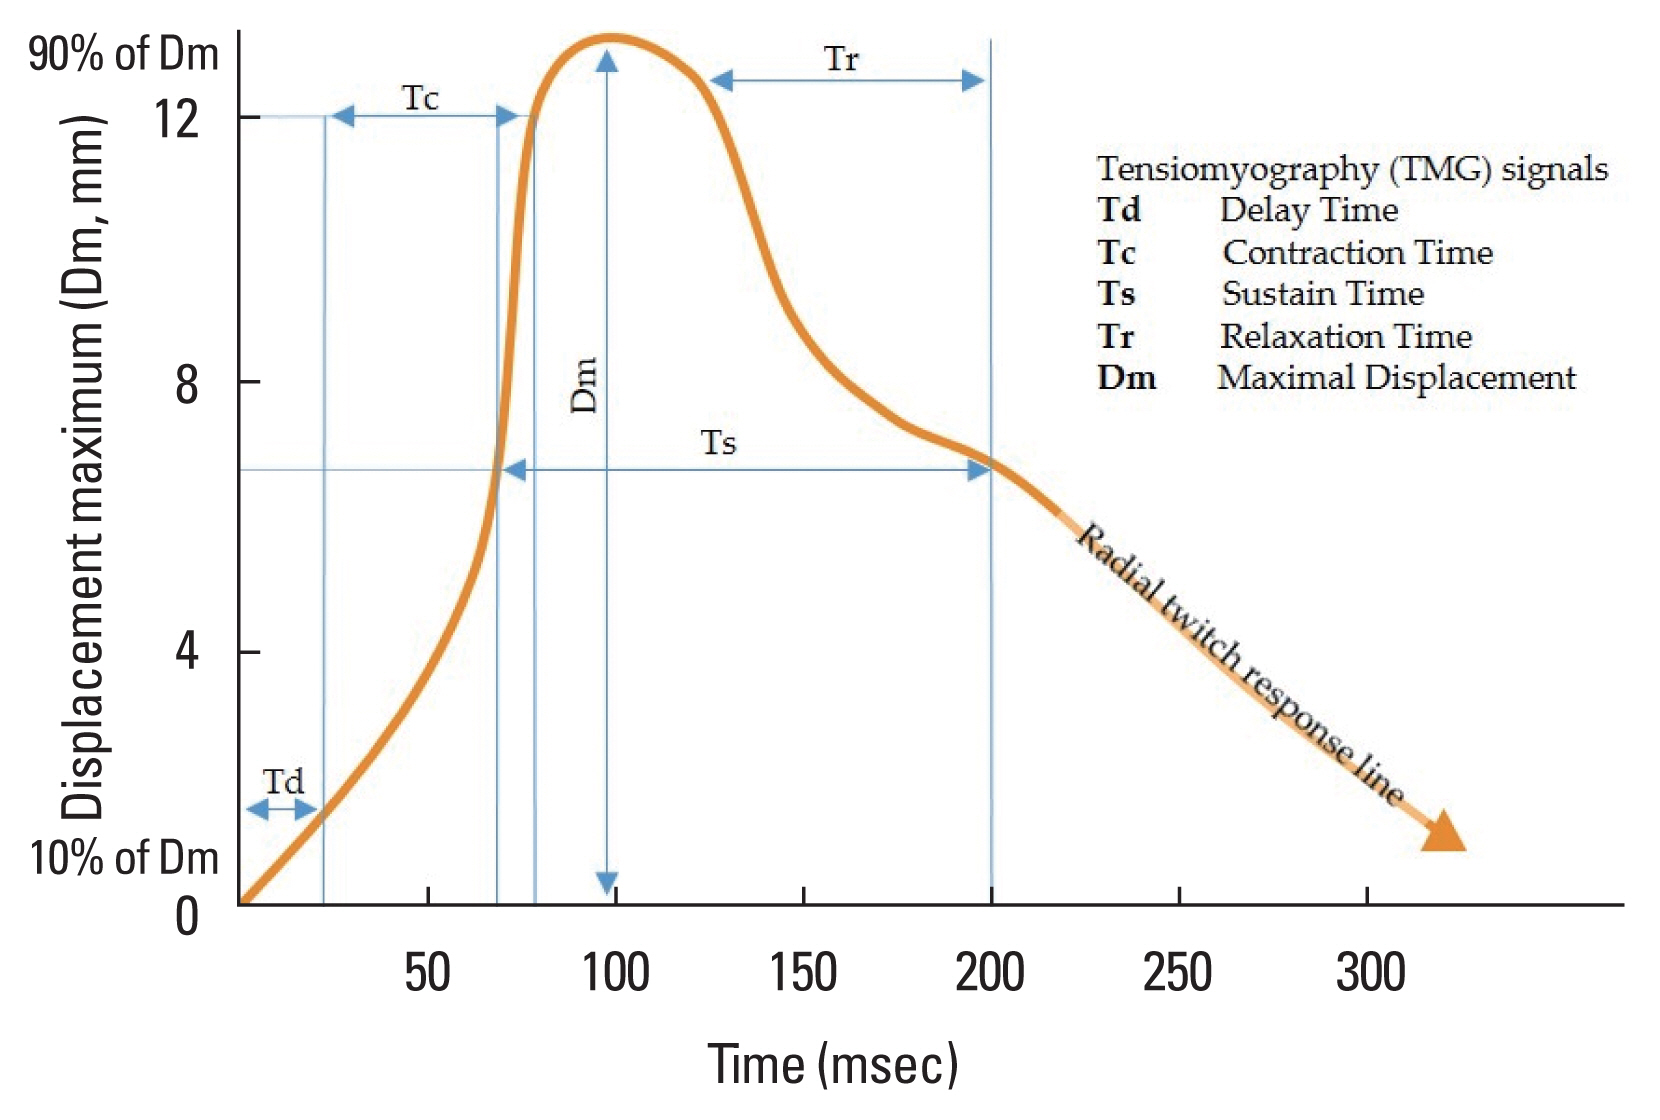
TMG-specific software receives signals on the 1-kHz scale. Two supra-maximal responses are stored and the average is calculated. The supra-maximal stimulation corresponds to minimal stimulation and it determines maximum amplitude of muscular deformation, recorded as maximal displacement (Rusu et al., 2013). The output of TMG is a displacement-time signal evaluated with standard parameters (Dahmane et al., 2001). As shown in Fig. 2, these parameters are delay time (Td), contraction time (Tc), sustain time (Ts), relaxation time (Tr), and maximal displacement (Dm). Td refers to the time between the electrical impulse and 10% of the contraction. Tc is the time between 10% and 90% of the contraction. Ts and Tr are the times between 50% of the contraction and 50% of the relaxation and the time between 90% and 50% of the relaxation, respectively. Dm is an important signal, representing the period of radial twitch response; it corresponds to maximal displacement of a muscle contraction, although recent studies have referred to changes in Dm as changes in contraction velocity (Macgregor et al., 2016). The radial twitch response (Vrn) is shown in Fig. 2. The equation describing this parameter is as follows (Krizaj et al., 2008):
where Vrn is the normalized speed response (0.8/Tc), Δdr is the maximal amplitude of the muscle response, and ΔTc represents the increase in muscle contraction time between 10% and 90% of the muscle response. Vr is the speed response without normalization and the 0.8 is a constant. The reproducibility and the validity of this method have been assessed by several authors. The reliability and degree of error of the parameter included in the Vrn equation (Tc) were also tested previously (Atkinson and Nevill, 1998; Ditroilo et al., 2013; Krizaj et al., 2008; Tous-Fajardo et al., 2010).
Lateral symmetry (LS) can be tested, which comprises the comparisons of the same muscle on both limbs of the body (e.g., dominant limb vs. nondominant limb). LS of the erector spinae can be recorded from left and right sides. The equation generated by TMG to calculate lateral symmetries is as follows:
where LS is lateral symmetry; TdR and TdL are values of right and left sides, respectively; TcR and TcL are values of right and left sides, respectively; TsR and TsL are value of right and left sides, respectively; and DmR and DmL are values of right and left sides, respectively. As suggested above, this study summarized as Table 1.
TENSIOMYOGRAPHY IN THE PATIENTS WITH LOW BACK PAIN
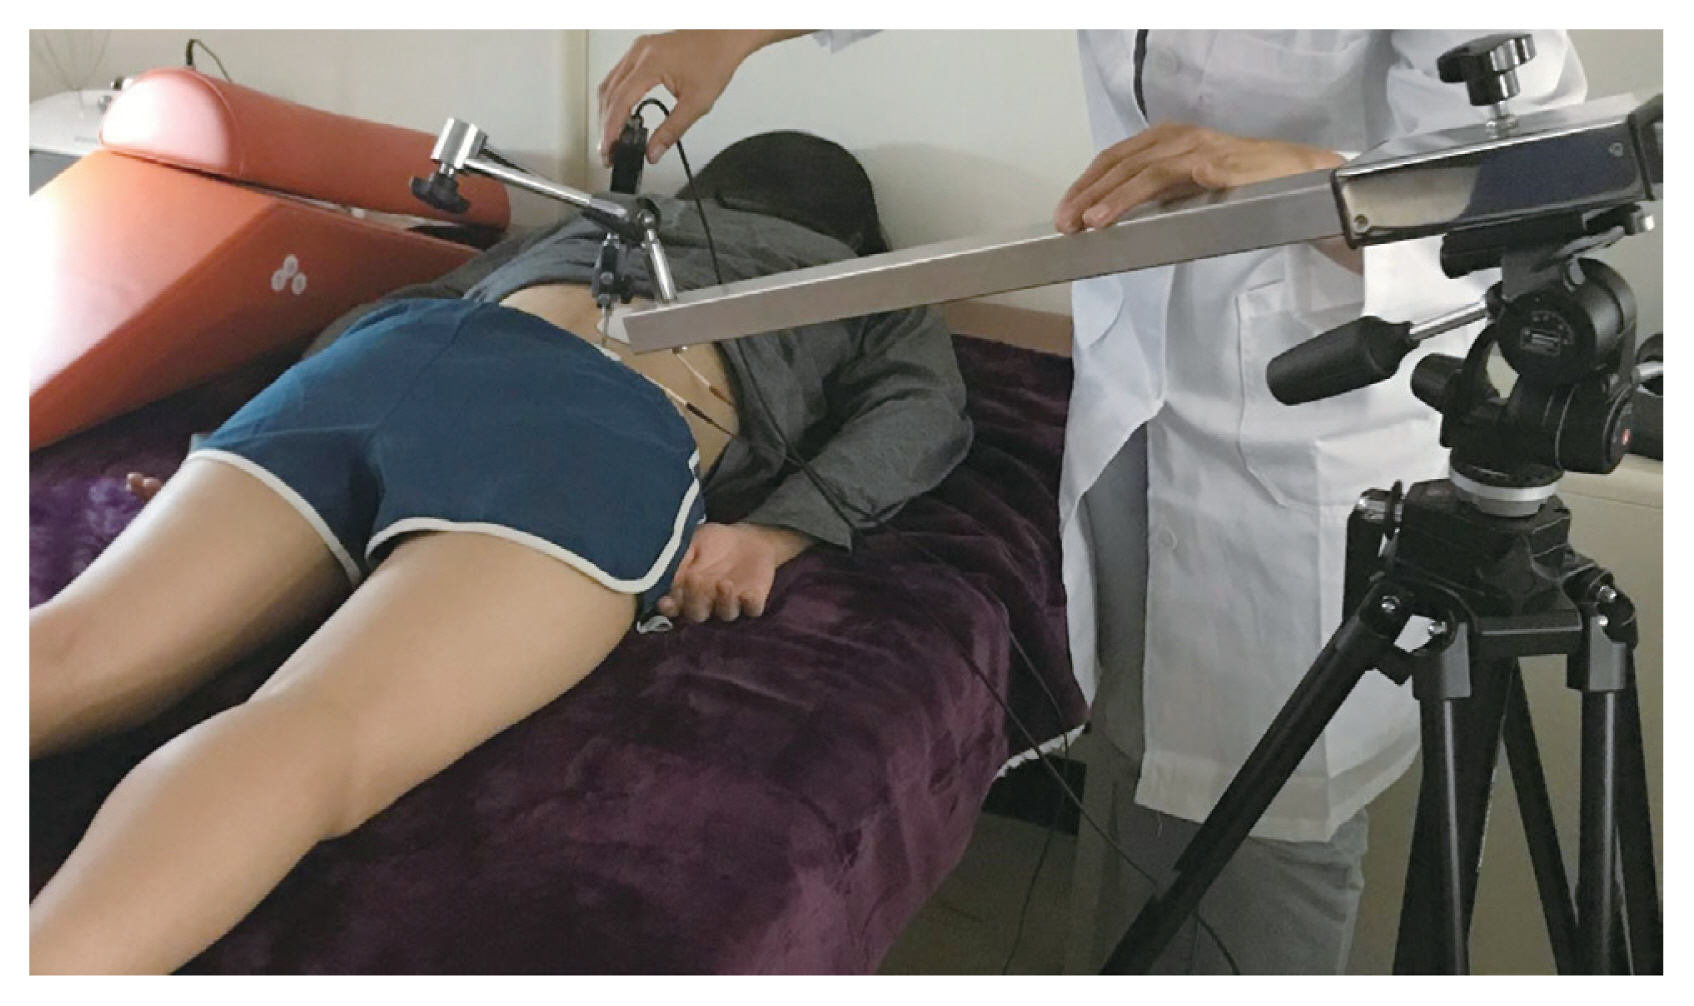
TMG is a simple, selective, and noninvasive method for measuring skeletal muscle contractile parameters using a linear displacement sensor. It assesses skeletal muscle thickening and low-frequency lateral oscillations of active skeletal muscle fibers during twitch contractions (Pisot et al., 2008). It was originally designed to be used by medical professionals, but it has transitioned from medicine to sports medicine, and it is now being utilized in exercise rehabilitation programs and for postinjury rehabilitation quantification (Raeder et al., 2016). Because of its noninvasive nature, TMG provides rapid accurate diagnostic data without discomfort or disruption of personal routines (Fig. 3). In practice, TMG and isokinetic muscle testing are useful as diagnostic methods for comparing left and right extremities and for analyzing muscle contraction properties of agonists and antagonists. Despite the fact that isokinetic muscle testing is not used in patients with LBP, the TMG can be performed noninvasively while the patient is stable; therefore, there is little difficulty in measuring left and right erector spinae muscles and/or rectus abdominis in patients with LBP.
The Tc of a muscle was found to be longer in type I muscle fibers, and shorter in type II fibers (Valencic and Knez, 1997). Dahmane et al. (2001) reported a very high correlation between the ratio of Tc and type I muscle fibers. It is said that Dm increases with increasing muscle atrophy, whereas Dm is smaller under muscle tension and stiffness (Pisot et al., 2008). Hunter et al. (2012) asserted that Dm can detect exercise-induced muscle damage as well as recovery. It was possible to measure LS and functional symmetry in that study. In other words, the risk of injuries may increase with the rise in stiffness because of decreased Dm, suggesting the possibility of promoting exercise performance using TMG monitoring (Wilson et al., 2019). TMG was used as an evaluation tool for muscle function by comparing the injured side with the healthy side of a specific ligament in athletes (Alentorn-Geli et al., 2015a; Alentorn-Geli et al., 2015b; Alvarez-Diaz et al., 2016a; Alvarez-Diaz et al., 2016b). There were significantly increased Ts, Tr, and Td of left erector spinae and in Tc and Td of right erector spinae only in the exercise intervention group after 8 weeks. Specifically, although the Ts of left erector spinae and the Td of left and right erector spinae between the exercise intervention group and the control group were not significantly different at baseline, these values were significantly different after 8 weeks. In other words, if the erector spinae muscles were weakened by LBP, TMG could detect imbalances between normal and/or abnormal sides of these muscles (Fig. 4).
Fig. 4 shows that the Tc of the left erector spinae was 68.78 msec, whereas that of the right erector spinae was 17.09 msec. Even when compared with reference value (left Tc 19.72 msec; right Tc 19.72 msec), it could be seen that there was a significant difference, and the shape of the graph appeared to show a significant difference. There also were significant differences in Tr, Td, Ts, and Dm between the left and right erector spinae muscles.
LOW BACK PAIN ASSESSED USING TENSIOMYOGRAPHY
Myofascial trigger points related to LBP may be active or latent when considering recognition of pain in the spine (Ge and Arendt-Nielsen, 2011; Gerber et al., 2013; Lluch et al., 2015). Active and/or latent myofascial trigger points generate spontaneous perceptible pain and may produce local or referred pain after stimulation (Ge and Arendt-Nielsen, 2011). The latter is as prevalent in patients with various spinal conditions as is the case in healthy subjects (Chiarotto et al., 2016). Nevertheless, both myofascial trigger points show differences in terms of electrophysiological activity levels (Yu and Kim, 2015), biochemical milieu (Shah et al., 2008), sonographic characteristics (Takla et al., 2016), thermography (Dibai-Filho and Guirro, 2015), magnetic resonance elastography (Chen et al., 2007), and TMG results (Calvo-Lobo et al., 2017). Calvo-Lobo et al. (2017) compared TMG, sonoelastography, and pressure pain threshold differences between the palpation areas of active and latent myofascial trigger points with respect to control points in the lumbar erector spinae muscles in subjects with LBP. A cross-sectional study was performed as follows: a convenience sample of 60 points (20 active myofascial trigger points, 20 latent myofascial trigger points, and 20 control points) was registered bilaterally in the lumbar erector spinae muscles from subjects with nonspecific lumbopelvic pain. With respect to the active myofascial trigger point, a moderate positive correlation was observed between the pressure pain threshold and Dm. Considering the control trigger points, a moderate positive correlation was shown between sonoelastography and Td at normal sites.
CONCLUSIONS
Several studies have used TMG as an injury prevention tool for the detection of muscle group imbalances and side-to-side asymmetries (García-García et al., 2019; Sánchez-Sánchez et al., 2018). It is also used to measure contractile properties (Dahmane et al., 2001; Đorđević et al., 2011) and mechanical responses based on radial muscle belly displacement (Tous-Fajardo et al., 2010). This short review suggests that it is necessary to use TMG in perform clinical trials to identify characteristics that appear in various erector spinae areas in LBP patients, and to quantify normal values. In other words, the first tasks are to identify the characteristics of various abnormal erector spinae muscles using TMG and to identify treatment methods. Future directions should be multidimensional for patients with LBP: validation with muscle force and/or endurance; determining trends of physiological adaptation through longitudinal designs; characterizing muscle fatigue; and developing the application of TMG for measurement of dynamic muscle contractions. In addition, it is hopeful that many studies will be conducted on LBP patients based on this study.