INTRODUCTION
In the human body, the foot plays a deterministic role in that walking ability is necessary for conducting everyday activities (Gouelle et al., 2016). With every step, the foot receives pressure that corresponds to approximately 80% of body weight. The foot is sometimes called the second heart because it pumps blood up to heart (Shin et al., 2008). Feet not only support body weight when maintaining a standing position or when walking, but they also maintain body balance against external shock (Hedrick, 1996).
When walking, the foot alternates between being a flexible structure and being a rigid structure. This ability of the foot depends on the foot arch, which provides support from the passive system such as tendons and plantar fascia, as well as on contraction of the active system such as muscles. Among the diverse structures that constitute the foot, the arch helps with adaptation of the foot on diverse surfaces and absorbs forces that are put on the foot while performing activities in a closed kinematic chain. The foot arch also acts as a robust lever during walking (Houglum and Bertoti, 2012). The arch of the foot is composed of the medial longitudinal arch, the transverse arch, and the lateral longitudinal arch. Because weight loading is particularly concentrated on the medial longitudinal arch in the standing position, maintaining the height and shape of the medial longitudinal arch is most important (Neumann, 2016).
The plantar fascia forms a strong fascia band from the rough surface of the calcaneus to the toe, supporting both sides of the foot and the sole. The plantar fascia plays an important role in every foot arch (Wearing et al., 2007). In particular, it provides primary passive support that maintains the height and shape of the medial longitudinal arch (Erdemir et al., 2004). Huang et al. (1993) stressed the importance of the plantar fascia, arguing that dissection of the plantar fascia can decrease the stability of the medial longitudinal arch by approximately 25% (Huang et al., 1993). When weight loading is concentrated on the medial longitudinal arch while maintaining a standing position, the tension coming from the extension of the plantar fascia acts as a tie-rod of the medial longitudinal arch, which minimizes the descent of the arch (Neumann, 2016). Here, a complete foot arch is made as the intrinsic and extrinsic muscles of the foot are contracted to complement the passive supports.
In the case of a flat foot, the heel does not touch the ground due to the overall pronation of the foot, which further induces dorsiflexion of the toes. In turn, tension of the intrinsic muscles of the foot and the plantar fascia increases. This phenomenon is broadly known as the windlass mechanism (Toullec, 2015). A flat foot cannot perform its task successfully under the condition of weight loading. Pathologic change can also be induced by stress that is repeatedly put on the plantar fascia (Houglum and Bertoti, 2012). In general, plantar fasciitis is caused by inflammation from repeated stress placed on the plantar fascia, degenerative change due to fibrosis, micro damage of the foot heel, and excess biomechanical use such as bearing body weight for extended amounts of time (Karabay et al., 2007; Riddle and Schappert, 2004; Thomas et al., 2010). Despite the recent increase of both plantar fasciitis and foot-related functional abnormalities, there is insufficient research on the potential for functional abnormality of the foot and plantar fasciitis among people who have flat feet. In this study, we verify this potential by comparing the foot function and thickness of the plantar fascia between young adults who have normal feet and those who have flat feet.
MATERIALS AND METHODS
Subjects
A total of 52 young men and women were selected as the subjects in this study. The sample size was determined by using G-Power with an effect size of 0.8, power of 0.8, and significant level of α=0.05. All the subjects agreed to voluntary participation in the experiment after listening to sufficient explanation of the experimental procedure. The subjects were evenly divided into a normal foot group (n=26) and a flat foot group (n=26) based on navicular drop test (NDT) results. For NDT, the subjects sat comfortably on a chair with their knee bent at 90°. Then, they put both feet in parallel without putting body weight on the ground. The part of the navicular node that protruded the most was detected through palpation, and the height was measured after marking the highest point with a dot. Next, the subjects slowly put body weight on their feet and stood up, and the node height of the navicula was measured in the standing position. We compared the height of the navicular node in a sitting position without weight loading and the height in a standing position with weight loading. If the difference was greater than 10 mm, the subject was classified as flat-footed. All the tests were implemented by the same measurer. Only subjects who are dextropedal were included in this study, and the measurements were conducted only on the right foot. Subjects who had a foot-related disease or a deformity of the foot other than flat feet were excluded from the sample. The procedures of this study were approved by the Research Ethics Committee of the Kaya University (approval number: 20170193).
Ultrasonography
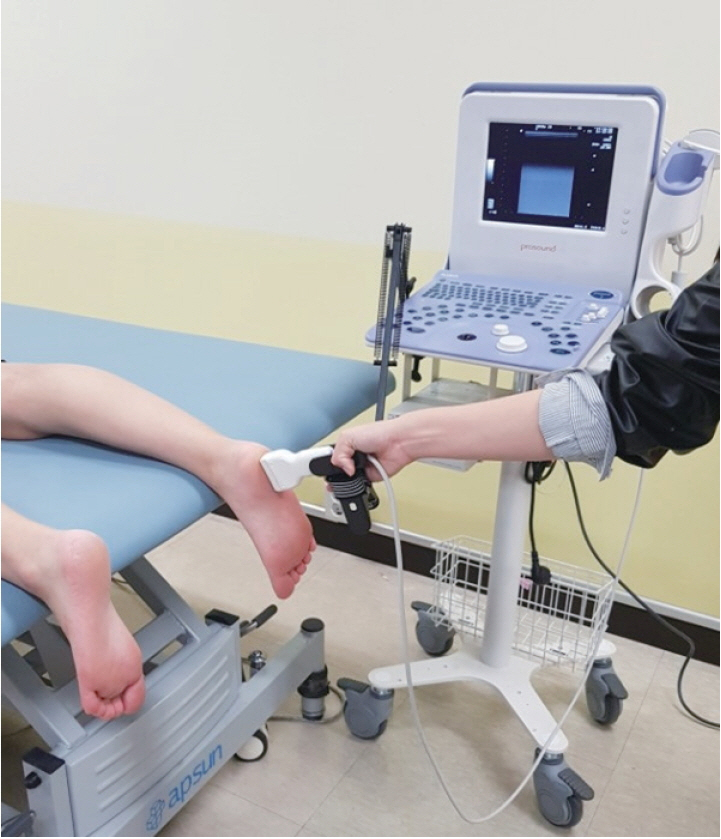
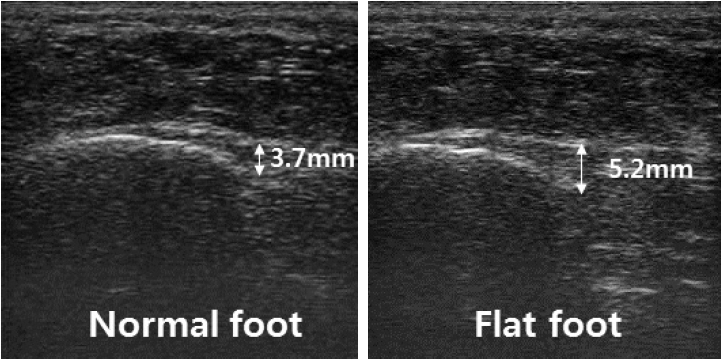
In this study, we used ultrasonography (Prosound 2, Hitachi Aloka Medical, Tokyo, Japan) to measure the thickness of the plantar fascia, using a 6.0- to 13.0-MHz linear transducer along with a transducer holder to constantly control the pressure and location of the transducer. For the ultrasonic image, the subject was in a prone position and made a knee extension with 90° flexion of the ankle. After vertically scanning the proximal interior where the plantar fascia is attached to the surface of the calcaneus, we measured the thickness of the plantar fascia on the node area of the calcaneus, where the plantar fascia originates (Abdel-Wahab et al., 2008; Radwan et al., 2016) (Fig. 1). Fig. 2 shows how we measured the thickness of the fascia with an ultrasonic image.
Foot function index
This evaluation method analyzes pain, restricted movement, and functional abnormality of the foot during daily activities (Budiman-Mak et al., 2013). The index is composed of a total of 23 items, where each item is scaled from 0, “no pain or difficulty,” to 10, “impossible to lead an independent life.” In our study, the subjects marked the items on the evaluation paper themselves after listening to an explanation.
Range of motion of ankle joint
To measure the ankle joint in dorsiflexion and plantar flexion, the subjects took a neutral position of the ankle in a supine position. After measuring the angle of dorsiflexion, the foot was put back in neutral position to measure plantar flexion (Hong and Kim, 2011).
Four-way ankle strength testing
Ankle strength (dorsiflexion, plantar flexion, inversion, and eversion) was measured using a handheld dynamometer (Commander Muscle Tester, JTECH Medical Inc., Midvale, UT, USA). This study progressed following the four steps. First, the subjects were classified into either the normal foot group and or the flat foot group through NDT. Next, we measured the thickness of the plantar fascia of in both the normal foot group and the flat foot group using ultrasonography and measured the foot function index (FFI) using the self-reported evaluations. Then, we measured the range of motion (ROM) of the ankle joint in dorsi-dorsiflexion and plantar-plantar flexion. Finally, a four-way ankle strength test was conducted. Tests of the thickness of the plantar fascia, ROM of the ankle joint, and muscle strength of the ankle were conducted for three times each, and average values were used for the analysis.
Statistical analysis
We conducted an independent sample t-test to compare the NDT outcome, thickness of the plantar fascia, ROM of the ankle joint, and ankle muscle strength between the normal foot group and the flat foot group. We used intraclass correlation coefficients (ICC) to check the inter- and intrarater reliability of the thickness of the plantar fascia as measured by ultrasonography. The measured data were processed using IBM SPSS ver. 18.0 (IBM Co., Armonk, NY, USA). A significant level was set at α=0.05.
RESULTS
General characteristics of the normal foot group and the flat foot group
This study had a total of 52 subjects (30 men and 22 women), including 26 subjects in the normal foot group (14 men and 12 women) and 26 in the flat foot group (16 men and 10 women). The general characteristics of the two groups are summarized in Table 1.
Reliability of the ultrasonography measurement
We used ICC2,1 and ICC3,1 to investigate the inter- and intrarater reliability of the measurement of the thickness of the plantar fascia (Table 2). The measurement showed high reliability both in terms of interrater reliability (0.88) and intrarater reliability (0.93).
Differences in foot function and thickness of plantar fascia
Table 3 shows the differences in foot function and plantar fascia thickness between the normal foot group and the flat foot group. The flat foot group showed a significantly thicker plantar fascia than the normal foot group. The FFI was also significantly higher in the flat foot group compared to the normal foot group. The ROM of the ankle joint in dorsiflexion was significantly lower in the flat foot group than in the normal foot group.
Differences in muscle strength of the ankle
Table 4 shows the differences in muscle strength of the ankle between the normal foot group and the flat foot group. The flat foot group showed significantly weaker muscle strength of the ankle in dorsiflexion and eversion compared to the normal foot group.
DISCUSSION
This study was conducted to verify the potential for foot dysfunction and plantar fasciitis among subjects with flat feet. Karabay et al. (2007) reported that the average thickness of the plantar fascia of patients with plantar fasciitis was approximately 4.8 mm. Abdel-Wahab et al. (2008) reported a similar result, saying that the plantar fascia thickness was about 4.9 mm among patients with plantar fasciitis. Other previous studies reported the average fascia thickness of patients with plantar fasciitis to be around 5.2–5.9 mm (Cardinal et al., 1996; Gibbon and Long, 1997; Kane et al., 2001). In our study, the average fascia thickness in the flat foot group was 4.7 mm, which is similar to or slightly thinner than the measures of previous studies. This supports the results of a previous study (Thomas et al., 2010) that plantar fasciitis is likely to occur when a pronated foot structure is continued. The prevalence rate of plantar fasciitis is approximately 10% of the total population. The share that plantar fasciitis occupies in all kinds of foot-related diseases is rapidly growing, with its proportion at approximately 15% (DiGiovanni et al., 2003). Following this time trend, preventive intervention that can improve flat feet in early stages should be applied.
In our study, significant differences in muscle strength and of ROM in dorsiflexion were observed between the two groups. The normal foot group showed higher values than the flat foot group in terms of both ROM in dorsiflexion and muscle strength. This is important because sufficient dorsiflexion at the initial contact during walking is necessary for balanced weight loading in the following loading response and middle stance phases (Houglum and Bertoti, 2012; Neumann, 2016). Flat feet will show unbalanced weight loading compared to normal feet due to the decreased muscle strength and ROM in dorsiflexion. If this mechanism is continued for a long time, the plantar fascia can become thickened due to the increased weight loading. Moreover, people with flat feet use excessive knee and hip joint flexion to compensate for the insufficient dorsiflexion during walking. This implies that energy efficiency will also be negatively affected.
Muscle strength of the ankle that is related to ankle movement is a strong predictor for the stability and balance of the ankle (Munn et al., 2003). In our study, the muscle strength of the ankle in dorsiflexion and eversion in the flat foot group was 2.39 N/kg and 2.14 N/kg, respectively, which was significantly lower than that of the normal foot group. This is a relatively lower value compared to a previous study reporting that muscle strength in dorsiflexion and eversion of healthy young adults (23.8 years) were 2.67 N/kg and 2.39 N/kg, respectively (Feger et al., 2016). In particular, muscle strength of the ankle in eversion is very important for preventing ankle sprain (Ashton-Miller et al., 1996). Young adults who are suffering from chronic ankle instability showed significantly weaker muscle strength in dorsiflexion and eversion compared to normal adults (Feger et al., 2016). This implies that the subjects with flat feet are more likely to be exposed to ankle instability and sprain unless they are provided with preventive intervention that can improve dorsiflexion and muscle strength of eversion.
In this study, the inter- and intrarater reliability of the measurement of thickness of the plantar fascia were 0.88 and 0.93, respectively. A previous study argued that 0.7–0.89 means high reliability and 0.90–1.00 means very high reliability (Munro, 1997). These results can be attributed to the use of a transducer holder, which was not used in the case of interrater reliability due to the skill difference of the user. In the case of intrarater reliability, the transducer holder was used to maintain the pressure and location of the transducer at a constant level. We also believe that this tool was effective for reducing standard deviation when measuring the plantar fascia thickness in our study. Studies that use ultrasonography will have to consider using a transducer holder to improve measurement reliability.
With regard to the FFI, which was composed of a total of 23 items with a maximum score of 230, in our study, the FFI was 1.54 and 7.42 in the normal foot group and the flat foot group, respectively. Considering the total score, there was no serious functional abnormality of the foot. However, the frequency of pain occurrence during daily activities was higher in the flat foot group than in the normal foot group. As foot pain is a predictor of plantar fasciitis (Cutts et al., 2012), efforts for pain reduction are required.
The plantar fascia becomes thicker with age or as the body weight increases. This, in turn, decreases flexibility and hinders the shock-absorbing function (Ozdemir et al., 2004). In our study, the number of obese subjects with a body mass index over 25 kg/m2 was 13, including four in the normal foot group and nine in the flat foot group. The average thickness of the plantar fascia of the 13 subjects was 4.6 mm, which is similar to the average thickness of the flat foot group. This is consistent with the outcome of previous studies, which reported that obesity is highly correlated with foot pain and that obesity is the major factor that induces plantar fasciitis (Mickle and Steele, 2015; Riddle et al., 2003; Thomas et al., 2010). Further studies will be required to verify the potential relationship between foot function and the probability of plantar fasciitis among obese subjects.
The flat foot group showed predictors that can cause plantar fasciitis, including foot pain, reduced ROM of the ankle joint, and hypertrophy of the plantar fascia. Development of diverse programs that can improve flat feet at an early stage will be required. The development of such a program will contribute to saving the national health expenses that are spent on treating plantar fasciitis in the future.