INTRODUCTION
Physical activity can provide both physical and psychological benefits for children (Ahn and Fedewa, 2011; Janssen and Leblanc 2010; Latorre Román et al., 2015). It also improves physical development and enhances the ability of the large and/or small muscles to function and protect the body for children with developmental disabilities (Verschuren et al., 2016). Physical fitness and body fat distribution during childhood have shown a high correlation with cardiovascular health in adulthood. It indicates that the level of physical activity in preschool children is associated with improvements in heart function and aerobic capacity (Bürgi et al., 2011). Therefore, fitness levels in childhood are a potent and important marker of health that has long-term effects (Ortega et al., 2008; Ortega et al., 2015). Several research studies have shown improved physical fitness levels in children with and without developmental disabilities after participating in physical activity. Physical fitness is the ability to perform daily activities and physical exercise. These physical strengths can be classified into health fitness, which is related to health, and exercise fitness, which is closely related to exercise function (Bittner, 2018). Physical fitness is often divided into health-related fitness and skill-related fitness. Health-related fitness factors consist of body composition, cardiovascular endurance, strength and endurance, and flexibility. Skill-related fitness factors consist of balance, power, agility, coordination, speed, and reaction time. This classification of fitness types is equally applicable to persons with disabilities.
To measure fitness levels for children with developmental retardation, test batteries have been created and validated (España-Romero et al., 2010). However, due to subjective evaluation criteria and the difficulty of adhering to detailed instructions, the ability to adequately measure the fitness levels in children with developmental retardation is often limited. In addition, physical fitness tests typically analyze only physiological components using relatively advanced and expensive equipment in controlled settings requiring well-trained experimenters. As a result, such tests may not be suitable for a large number of participants (Fjørtoft et al., 2011). Since developmental retardation often occurs from birth, it is desirable to provide specific physical activity programs in the early stages of growth. The gross motor development test is an evaluation method that measures individual muscle function in younger children. This is one of the few tests that examine qualitative elements of basic motor skills based on normative components. Currently, there is a lack of information regarding the validity and reliability of fitness tests in children with developmental disabilities. There is a need for a valid and reliable way to assess the relationship between physical health and fitness for this particular group. As of now, only a small number of research studies have analyzed the physical abilities and fitness levels in children with developmental disabilities.
Taking the above into account, a reliable test battery is needed to analyze fitness levels in children with developmental disabilities. Therefore, this study aims to: (1) assess the test-retest reliability of gross motor function and physical fitness and (2) measure the validity of this test battery to see differences in performance in children with developmental disabilities.
MATERIALS AND METHODS
Subjects
Prior to this study, male children aged 9 to 12 years voluntarily participated in this study. Inclusion criteria included having enrolled in school from early childhood, having developmental disabilities and not having exercised regularly for a duration of six months. Forty-two participants were initially screened to determine eligibility based on the above criteria. However, seven participants declined to participate. Finally, 35 participants were enrolled in this study. Among the participants, those with visual impairment, hearing impairment, and/or physical impairment were excluded. In addition, subjects who could not be measured or were required to stop the assessment were excluded from this study as well as those who had received any medical treatment known to affect physical condition or had undergone any major surgery during the one year prior to the start of the study. The following were also reasons for exclusion: a history of coronary arterial disease or cerebrovascular disease, impairment of a major organ system, uncontrolled hypertension, cancer, or psychiatric diseases such as eating disorders (Jee, 2019). Complete subject characteristics are presented in Table 1.
Experimental protocol
The study was completed in accordance with the norms of The Declaration of Helsinki (2013 version) and approved by the Institutional Review Board at Sahmyook University (2-1040781-AB-N-01-2016120HR). This single-blind, randomized, controlled trial was conducted in a research center at Hanseo University from April 13 to 20, 2019. The first assessment was conducted in the rehabilitation research center on April 13. A week later on April 20, a retest was given to 35 children who were continually encouraged to complete all the tests. The children were motivated and encouraged at all times to complete the tests. All subjects were recruited through advertisements and a written informed consent was obtained before enrollment. Parents voluntarily signed an informed consent form for the participation of their children in this study.
Assessment protocols
Body composition measurements
The body composition of the subjects was measured using bioelectrical impedance analysis method with a Body Composition Analyzer (InBody 230, BioSpace, Seoul, Korea), which is an impedance device that uses stainless steel interfaces for electrodes. Height was measured using a height measuring device (Analogue height tester, Samwha, Seoul, Korea). The subjects stood upright by placing their bare feet on the foot electrodes and gripping the hand electrodes. Two pairs of tactile electrodes were attached to the surfaces of both hands and feet: palms, fingers, front soles, and rear soles. Analysis of body composition was measured before dinner and after voiding (Jee, 2019).
Test of gross motor development
Test of gross motor development scale-2 (TGMD-2) was used in this study, which is a standardized criterion designed to measure change in the gross motor function of children with cerebral palsy. It is a criterion-related test that measures individual muscle function of children from 3 to 10 years of age and is one of the methods for examining the qualitative elements of basic motor skills based on criterion components. The components of this scale are tools that allow the instructor to quickly and accurately measure whether the child has a delay in the underlying motion pattern as compared to their peers. It is composed of 12 major muscle movement patterns and was separated into two sections: locomotion skills and object control skills. The locomotion section was composed of running, galloping, hopping, leaping, horizontal jumping, and sliding. The object control section was composed of hitting a stationary ball, stationary dribbling, catching, kicking, overhand throws, and underhand rolls.
The examiner analyzed the basic motor skills of the children in TGMD-2 by awarding 1 point if they were able to do the task and 0 points if they could not. The two results were added together for a total score using subscales (Allen et al., 2017). The highest possible sum of the six subscales in the locomotion section was 48 points, and the highest possible sum of the six subscales in the object control section was 48 points. TGMD-2 is simple, easy to implement, and useful for identifying weaknesses in exercise programs. It is one of the most popular exercise examinations used by physical education specialists who can use the test results to create specific training objectives as well as customizing individual training programs (Bittner, 2018).
Test of physical fitness
Strength is an individual factor that significantly increases the functional capacity of people with disabilities (Calder et al., 2018). In this study, grip strength was measured to assess muscle strength. Grip strength is measured with a digital hand dynamometer (TKK-5401, Takei Inc., Tokyo, Japan) in a seated position. Participants were seated in a chair with an armrest with the shoulder at 0° flexion, the elbow at 90° flexion, and the wrist between pronation and supination with the hand in a vertical position. When holding the hand dynamometer, the middle phalanges rested on the handle. Participants squeezed the dynamometer with maximum force three times with 1-min recovery between attempts. This had to be done for both hands in case handedness was not self-evident (Oppewal et al., 2013). The maximum produced force out of the six attempts was used as the test result and calculated to the nearest kg. Results were only valid if the test instructor was convinced that the participant squeezed with maximum effort. To check that the participant squeezed with maximum effort, test instructors observed the contracting muscles of the arm and hand, the turning of white in the phalanges, facial expressions, and the consistency of the three attempts. Participants were given the option to squeeze a rubber ball first to assure understanding of the task.
Muscle endurance is individual factors that significantly increase the functional capacity of people with disabilities (Calder et al., 2018). In this study, muscle endurance was measured with a modified sit-ups test. The details of the method are specified in the following: The subjects lied down on a mat with their hands behind their head and their legs bent at 90°. An assistant held both ankles to the floor with a distance of 30 cm between the subjects’ feet. When the subjects were instructed to begin, they curled forward and contacted their knees with their elbows. The standard to complete one full sit-up was to touch the knees with both elbows and then have their backs touch the floor. The maximum number of repetitions performed in 60 sec was recorded.
The sit and reach flexion test was measured by a flexibility meter (TKK1859, Takei Inc., Tokyo, Japan). The specific method for performing this test is detailed as follows: The test apparatus included a ruler (25 cm upwards, 40 cm downwards) placed at the base of the subjects’ feet, which were positioned 5 cm apart. Both legs were fully extended along the floor with their upper bodies in an upright sitting position. The subjects inhaled and then exhaled as they leaned forward to extend their fingers to the furthest point possible. Instructions were given to refrain from bouncing the waist forward when reaching. Throughout the test, the subjects’ legs were fully extended and the highest two measurements were recorded.
In this study, cardiopulmonary endurance was measured by having the subjects complete a 15-m shuttle run test. This 15-m shuttle run test is a commonly used aerobic fitness test. It is also known as a multistage fitness test, beep or bleep test, among other names. Required equipment includes a flat, nonslip surface, marking cones, 15-m measuring tape, beep test audio, music player, and recording sheets. Prior to the test, an expert explained the test procedures to the subjects and had them complete warm-ups. This test involved continuous running between two lines 15 m apart in time to recorded beeps. For this reason, the test is also often called the ‘beep’ or ‘bleep’ test. The subjects stood behind one of the lines facing the second line, and began running when instructed by the recording. The speed at the start was quite slow. The subjects continued running between the two lines, turning when signaled by the recorded beeps. After about 1 min, the intervals between beeps became shorter, thus increasing the pace. This continued for each subsequent minute (level). If the line was reached before the beep, the subjects waited until the next beep before continuing. If the line was not reached before the beep, the subjects were given a warning, but continued to run to the line, turned, and tried to catch up with the required pace within the next two beeps. The subjects were given a warning the first time they failed to reach the line (within 2 m), and eliminated after the second warning. The subject’s score was the level and number of shuttles (15 m) reached before they were unable to keep up with the beeps. An expert recorded the last level completed. The norms table below provides a very rough idea of what scores would be expected for adults, using the standard Australian beep test version as shown in Table 2. These scores can be converted to VO2max equivalent scores.
Statistical analysis
Data were analyzed using SPSS ver. 18.0 (SPSS Inc., Chicago, Illinois, USA) and the significance level was set at P≤0.05. The data are shown in descriptive statistics for mean and standard deviation (SD). Prior to the analysis of measurements including gross motor development questionnaire and physical fitness variables, the Kolmogorov–Smirnov test was used to determine the normality of distribution for the examined variables. Reliability analysis was performed using intraclass correlation coefficients (ICCs) in the pretest-posttest and Bland-Altman graphs study. The convergent validity was performed by Pearson correlation. Analysis of variance was used to analyze differences between age groups. ICC was used to determine interobserver reliability in the sprint test. Lastly, a Pearson correlation analysis was conducted between tests. For reference, if a correlation coefficient is over 0.90, it considered as excellent, between 0.75 and 0.90 as good, between 0.50 and 0.75 as moderate, and under 0.50 as poor (Koo and Li, 2016).
RESULTS
Comparison of demographic factors
As shown in Table 1, a total of 35 children between 9 and 12 years of age volunteered to participate in this study. Their mean age was 10.31±1.25 years old, and mean body mass index was 21.20±2.57 kg/m2. The age distribution was as follows. Twelve (34.3%) were 9 years old, 9 (25.7%) were 10 years old, 7 (20.0%) were 11 years old, and 7 (20.0%) were 12 years old. The subjects were elementary school students with mental disability. Specifically, all the subjects had developmental disorders. Thirteen had autism and 22 had intellectual disabilities.
ICC and confidence interval on locomotion of TGMD-2
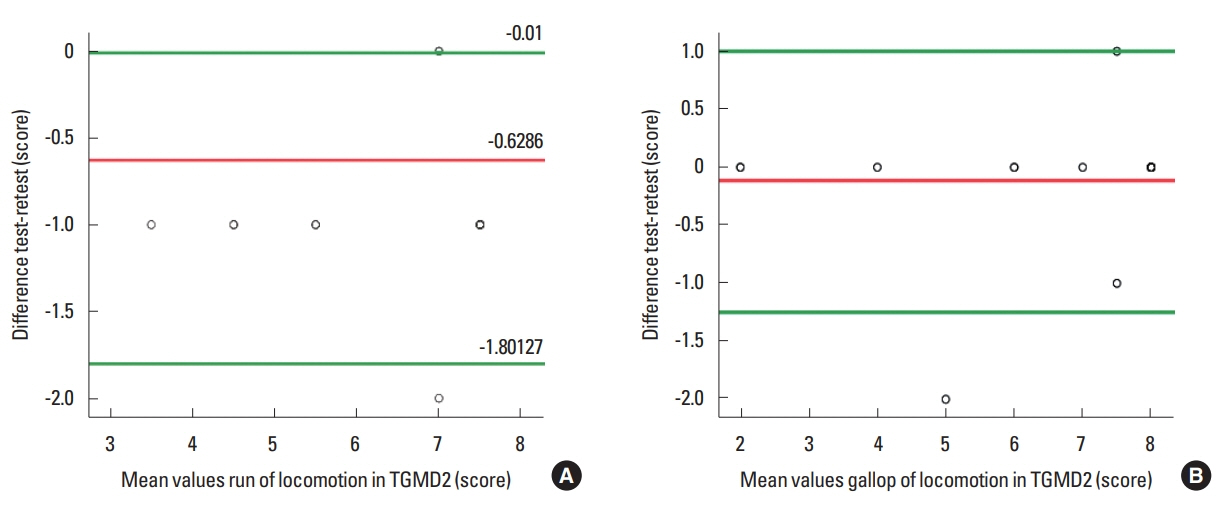
Detailed statistics and ICC results for all pretests and posttests are shown in Table 3. In the run test of locomotion skills in TGMD-2, an ICC of 0.911 (95% confidence interval [CI], 0.831–0.954) was achieved. The Bland-Altman graph indicated limits of agreement (LoA) with 2 SD of 0.54 and −1.08 with a mean difference of −0.63±0.60 (Fig. 1A). As for the gallop test of locomotion skills in TGMD-2, an ICC of 0.954 (95% CI, 0.911–0.977) was achieved. The Bland-Altman graph indicated LoA (2 SD) of 0.59 and −1.33 with a mean difference of −0.37±0.49 (Fig. 1B). Regarding the hop test of locomotion skills in TGMD-2, an ICC of 0.862 (95% CI, 0.744–0.928) was achieved. The Bland-Altman graph indicated LoA (2 SD) of 1.03 and −1.26 with a mean difference of −0.11±0.58. Concerning the leap test of locomotion skills in TGMD-2, an ICC of 0.788 (95% CI, 0.620–0.887) was achieved. The Bland-Altman graph indicated LoA (2 SD) of 0.44 and −2.04 with a mean difference of −0.80±0.63. In the horizontal jump test of locomotion skills in TGMD-2, an ICC of 0.726 (95% CI, 0.522–0.852) was achieved. The Bland-Altman graph indicated LoA (2 SD) of 1.21 and −1.61 with a mean difference of −0.20±0.72. Regarding the slide test of locomotion skills in TGMD-2, an ICC of 0.698 (95% CI, 0.479–0.835) was achieved. The Bland-Altman graph indicated LoA (2 SD) of 1.21 and −1.61 with a mean difference of −0.14±0.85. Finally, as for the sum of locomotion skills in TGMD-2, an ICC of 0.936 (95% CI, 0.877–0.967) was achieved and the Bland-Altman graph indicated LoA (2 SD) of 1.02 and −1.61; the average difference was −2.51±1.80.
ICC and CI on object control of TGMD-2
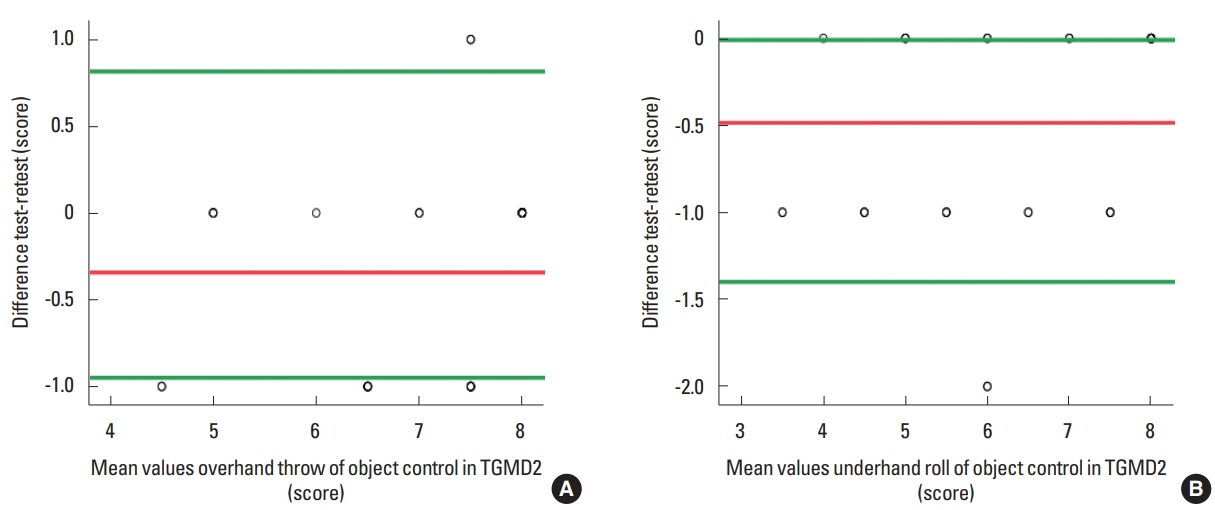
Detailed statistics and ICC tests for all pretests and posttests are shown in Table 4. In the hitting a stationary ball test of object control skills in TGMD-2, an ICC of 0.941 (95% CI, 0.887–0.970) was achieved. The Bland-Altman graph indicated LoA (2 SD) of 0.56 and −1.41 with a mean difference of −0.43±0.50. As for the stationary dribble test of object control skills in TGMD-2, an ICC of 0.500 (95% CI, 0.205–0.712) was achieved. The Bland-Altman graph indicated LoA (2 SD) of 1.26 and −2.34 with a mean difference of −0.54±0.92. Regarding the catch test of object control skills in TGMD-2, an ICC of 0.671 (95% CI, 0.439–0.819) was achieved. The Bland-Altman graph indicated LoA (2 SD) of 0.80 and −1.54 with a mean difference of −0.37± 0.60. Concerning the kick test of object control skills in TGMD-2, an ICC of 0.829 (95% CI, 0.688–0.910) was achieved. The Bland-Altman graph indicated LoA (2 SD) of 1.00 and −1.68 with a mean difference of −0.34±0.68. As for the overhand throw test of object control skills in TGMD-2, an ICC of 0.868 (95% CI, 0.754–0.931) was achieved. The Bland-Altman graph indicated LoA (2 SD) of 0.82 and −1.50 with a mean differences of −0.34±0.59 (Fig. 2A). Regarding the underhand roll test of object control skills in TGMD-2, an ICC of 0.921 (95% CI, 0.849–0.959) was achieved. The Bland-Altman graph indicated LoA (2 SD) of 0.71 and −1.69 with a mean difference of −0.49±0.61 (Fig. 2B). Finally, as for the sum of object control skills in TGMD-2, an ICC of 0.979 (95% CI, 0.959–0.989) was achieved. The Bland-Altman graph indicated LoA (2 SD) of 1.02 and −6.05 with a mean difference of −2.51±1.80.
ICC and CI on physical fitness test battery
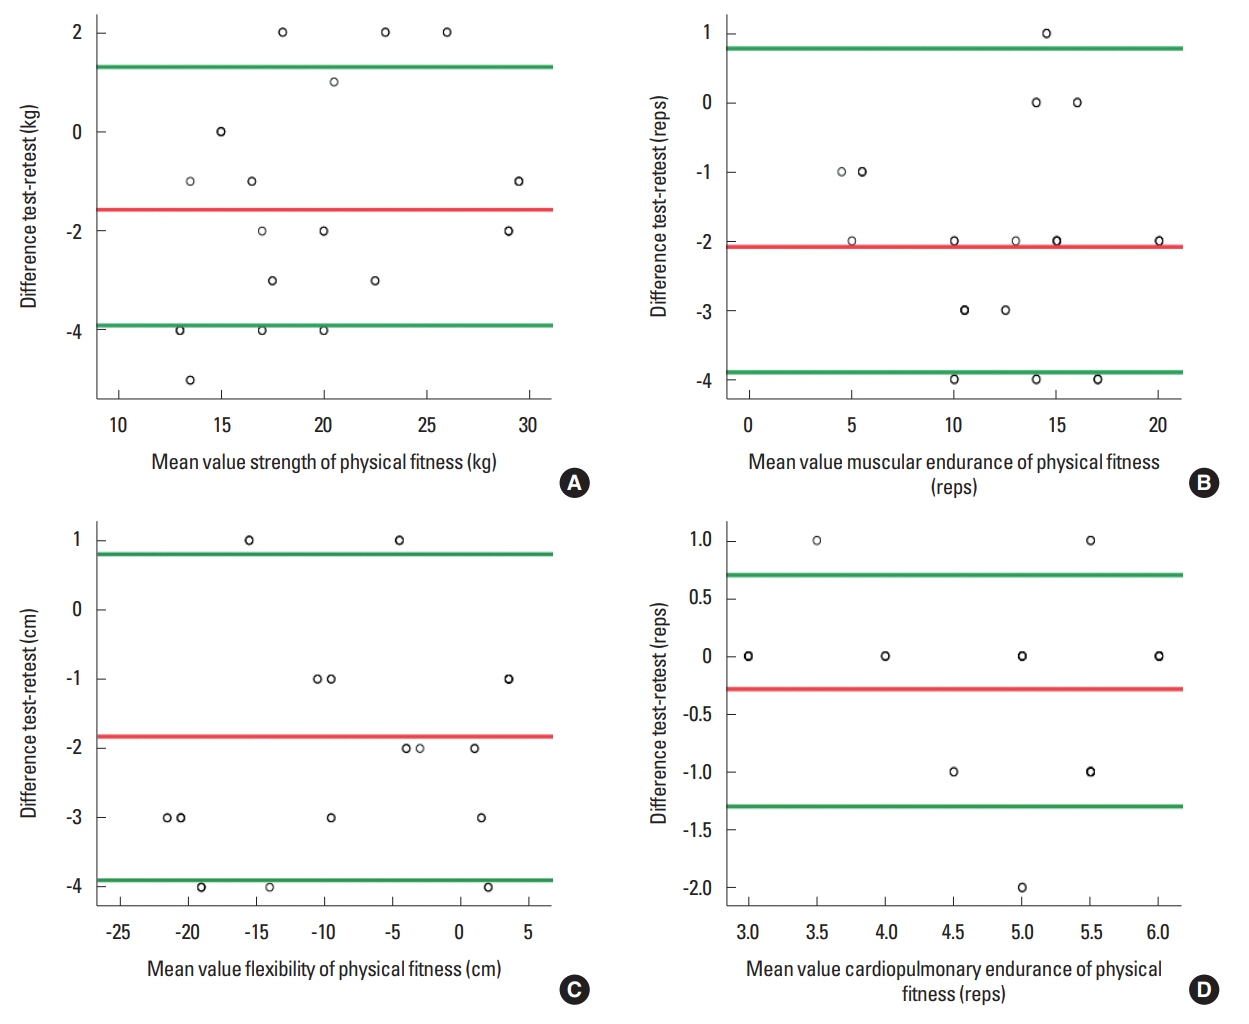
Detailed statistics and ICC tests for all pretest and posttests are shown in Table 5. In the strength test of physical fitness test battery, an ICC of 0.923 (95% CI, 0.853–0.960) was achieved. The Bland-Altman graph indicated LoA (2 SD) of 2.77 and −5.91 kg with a mean difference of −1.57±2.21 kg (Fig. 3A). As for the muscular endurance test of physical fitness test battery, an ICC of 0.924 (95% CI, 0.888–0.970) was achieved. The Bland-Altman graph indicated LoA (2 SD) of 0.78 and −4.95 reps with a mean difference of −2.09±1.46 reps (Fig. 3B). Concerning the flexibility test of physical fitness test battery, an ICC of 0.983 (95% CI, 0.966–0.991) was achieved. The Bland-Altman graph indicated LoA (2 SD) of 1.45 and −5.10 cm with a mean difference of −1.83±1.67 cm (Fig. 3C). Finally, as for the cardiopulmonary endurance test of physical fitness test battery, an ICC of 0.805 (95% CI, 0.648–0.897) was achieved and the Bland-Altman graph indicated LoA (2 SD) of 1.11 and −1.68 reps; the average difference was −0.29±0.71 reps (Fig. 3D).
Relationships between gross motor function and physical fitness
Among the locomotion skills, running was significantly related with flexibility (r=0.395, P=0.019). Hopping was significantly related with strength (r=0.402, P=0.017). Leaping was significantly related with muscular endurance (r=0.596, P=0.001) and strength (r=0.529, P=0.001). Sliding was significantly associated with flexibility (r=0.423, P=0.011). Among object control skills, dribbling a ball was significantly related with muscular endurance (r=0.356, P=0.036) and flexibility (r=0.404, P=0.016). Overhand ball throwing and underhand rolling were significantly related with flexibility (r=0.654, P=0.001; r=0.353, P=0.037).
DISCUSSION
This study was initiated to determine how accurately gross motor function and health fitness could be measured for children with developmental disabilities aged 9 to 12 years old. All tests were suitable for children and were conducted without any incident. The premise was that the measurements for gross motor function and health fitness should not be hard to perform nor require complex technical equipment. In this regard, these tests are designed to measure large groups of children and to monitor the motor development and health fitness levels of children over time.
The purpose of TGMD-2 is to examine what is taught to preschool children and early elementary school students (3–10 years old), including adaptive education, and is designed for use by a variety of professionals with minimal training. On the other hand, it is possible to interpret the child with developmental disability as the absolute evaluation and the relative evaluation, and to evaluate the continuous process of the muscle movement technique. Although the quantitative aspects of time, distance, and accuracy used in basic gross motor skills are important, it is also the purpose of TGMD-2 to focus on assessing the proficiency of movements in children with disabilities.
Developmental disability is not defined as a specific type of disability, but a characteristic state in which average rates of development are not shown in infancy and childhood. From a medical point of view, the development of social interaction, communication, and cognitive skills appropriate for peers their age is poor. More specifically, it refers to significant delay in two or more developmental domains in children aged 5 years or younger (Vasudevan and Suri, 2017).
Physical abilities are also lower than normal children, which is another characteristic of developmental disability. In other words, assessment is a very important factor in the growth and development of children. In addition, reliability and validity of the evaluation tools for growth and development are important. In fact, the TGMD is an instrument for assessing how well children with developmental disabilities use their gross motor. However, the reliability and validity of this tool were only investigated overseas, and there were few studies on children with disabilities in Korea.
According to the results of this study, when considering the ICC gained from the sum of locomotion skills of TGMD-2, it represented a very high coefficient (r=0.936). However, when considering each locomotion skill, the coefficients of leaping (r=0.788), horizontal jumping (r=0.726) and sliding (r=0.698) were not higher than those of running (r=0.911), galloping (r=0.954) and hopping (r=0.862). These tendencies were similar in the ICC of object control skills in TGMD-2. In other words, the coefficients of stationary dribbling (r=0.500) and catching a ball (r=0.671) were not higher than those of hitting a stationary ball (r=0.941), kicking a ball (r=0.829), overhand throwing (r=0.868), and underhand rolling (r=0.921). Koo and Li (2016) reported that based on the 95% confident interval of the ICC estimate, values less than 0.5, between 0.5 and 0.75, between 0.75 and 0.9, and greater than 0.90 are indicative of poor, moderate, good, and excellent reliability, respectively. Considering the above ranges, the correlation coefficients in TGMD-2 is fairly reliable, except for sliding among locomotion skills and for stationary dribbling and ball catching among object control skills. In other words, when evaluating gross motor function in children with developmental disabilities, it is necessary to pay extra attention when evaluating these three areas. However, the ICC gained from the sum of locomotion skills and the sum of object control skills in TGMD-2 were over 0.90, which was considered to be safe, easy to perform, and suitable for children with developmental disabilities. Meanwhile, the reliability of the four methods of physical fitness tests for children with disabilities was very high. In other words, the ICC of strength (r=0.923), muscular endurance (r=0.924) and flexibility (r=0.983) were over 0.90, whereas the ICC of cardiopulmonary endurance (r=0.805) were evaluated as ‘high.’
The locomotion and object control skills in TGMD-2 were associated with health-based physical fitness in children with developmental disabilities. According to the results of this study, running among locomotion skills was significantly correlated with flexibility (r=0.395). Moreover, hopping was significantly related with strength (r=0.402). Leaping was significantly related with muscular endurance (r=0.596) and strength (r=0.529). Sliding was significantly associated with flexibility (r=0.423). Among object control skills, dribbling a ball was significantly related with muscular endurance (r=0.356) and flexibility (r=0.404, P= 0.016). Overhand throwing and underhand rolling were significantly related with flexibility (r=0.654, r=0.353). These results indicate that the function using gross motor skills is affected to some extent by the health-based fitness factors. In this regard, Raynor (1998) reported that reaction time is a noteworthy measurement since it shows the speed in which the neuromuscular system can respond to environmental demands and thus increases the reaction time in individuals with developmental difficulties in motor coordination. Maher et al. (2007) also suggested that gross motor function was shown to be a significant predictor of overall physical activity for Australian youth with cerebral palsy, with those with higher levels of gross motor impairment being less likely to participate. These studies suggest that gross motor skills may be reduced if a child with developmental disabilities does not participate in physical activity programs. Conversely, the assumption is that gross motor skills will no longer decrease when participating in physical activity. Similar to the results of this study, findings of other studies have revealed that increased physical activity had significant beneficial effects on motor skills and cognitive development. Out of ten studies examining the effects of physical activity on the motor skill outcomes of preschool children, eighty percent reported significant improvements in motor development following physical activity (Adamo et al., 2016; Bellows et al., 2013; Jones et al., 2011; Zask et al., 2012).
Considering that this study was limited to children with developmental disabilities between 9 and 12 years of age, a larger number of subjects for each age group would greatly improve this study, which is needed to establish age and gender-specific norms. Nevertheless, this study provides insight into the reliability of gross motor function and physical fitness tests for children with developmental disabilities.
Ultimately, the results of this study suggest that the TGMD-2 for assessing gross motor function and the physical fitness test were fairly reliable and acceptable for use in children with developmental disabilities.