INTRODUCTION
Obese individuals display an impaired capacity to mobilize and oxidize fat compared to lean individuals. This impaired capacity contributes to positive fat balance resulting in adipose tissue accumulation, and eventually weight gain (Blaak and Saris, 2002). Obesity relates directly to risk of cardiovascular diseases (CVDs). Therefore, preventing weight gain and facilitating weight loss are cornerstones to reducing the risk of CVD (Lavie et al., 2009).
Regular exercise is a key component of clinical weight management due to its ability to increase energy expenditure and promote fat utilization (Goodpaster et al., 2003; Potteiger et al., 2008; Ryan and Heaner, 2014). Nevertheless, the influence of exercise training on fat oxidation (FAO) and energy expenditure in overweight and obese individuals is still unclear. There is a lack of consistent results detailing exercise training promotion of FAO in obese individuals. Some reports demonstrated the improvement of FAO caused by exercise training (Schrauwen et al., 2002; Schutz et al., 1992), while some studies reported contradictory results (Buemann et al., 1992; Nicklas et al., 1997). Similarly, the effect of exercise training on resting energy expenditure is in doubt.
Aerobic exercise has been widely accepted amid reductions in body weight (BW) and fat mass (FM) (Potteiger et al., 2008). However, the majority of aerobic exercise studies failed to demonstrate increments in fat-free mass and resting energy expenditure (Wilmore et al., 1999). Moreover, loss of muscular tissue is a common problem often found in weight management programs. Adding resistance training into an aerobic exercise program is a strategy to prevent loss of muscle mass. Additionally, resistance training promotes energy expenditure and FAO which assist to maintain energy balance and prevent weight gain (Kirk et al., 2009).
Although the benefits of aerobic exercise and resistance training are well documented, little is known regarding the effects of combined aerobic exercise and resistance training, i.e., concurrent training in obese individuals. A meta-analysis in obese adults suggested that concurrent training is the most efficacious means to improve adiposity parameters as compared with aerobic exercise or resistance training alone (Schwingshackl et al., 2013). Moreover, a recent randomized controlled trial suggested that concurrent training produces greater decreases in body fat percentage (%BF), waist circumference, and body mass index (BMI) than aerobic exercise alone (Sigal et al., 2014).
Much attention has focused on the influence of dietary fat composition in energy and weight balance (Krishnan and Cooper, 2014; Piers et al., 2002; Polley et al., 2018; Stevenson et al., 2017). Numerous studies demonstrated the benefits of dietary polyunsaturated fatty acids (PUFAs) (Saini and Keum, 2018). Consuming PUFAs has been shown to elicit moderate body fat-lowering effects (Albracht-Schulte et al., 2018; Stevenson et al., 2017). High PUFAs consumption may potentially lead to improved weight maintenance and positive effects amid energy expenditure due to increments in thermogenesis, FAO and resting energy expenditure (Jones et al., 2008). High PUFAs consumption also provides beneficial effects in terms of insulin sensitivity, anti-inflammation, and blood lipid lowering (Albracht-Schulte et al., 2018).
Currently, in Thailand, Eri silkworm rearing is being widely promoted in public and private sectors. Pupae, which accounts for 60% of the cocoon weight, is discarded as waste material. However, the Eri silkworm pupae were found to be enriched with PUFAs such as palmitic acid, oleic acid, and linoleic acid (Kim et al., 2010) as well as α-linolenic acid (Shanker et al., 2006). A nutritional and toxicological study on the Eri silkworm pupae oil showed that it is safe and nutritionally equivalent to commonly used sun-flower oils, but with added health benefits due to its high α-linolenic acid content (Longvah et al., 2012). Moreover, a comprehensive review of their toxicological assessment has indicated that the Eri silkworm pupae is safe and has great potential as novel food resources (Gao et al., 2018). Therefore, promoting the pupae as an alternative food would provide added value to the discarded silkworm.
As mentioned above, concurrent training as well as dietary PUFAs consumption yields beneficial effects on weight management. Nevertheless, the combined effects of concurrent training together with PUFAs intake have not yet been studied. Thus, we hypothesized that the combination of concurrent training with Eri PUFAs intake would improve energy expenditure and FAO at rest and during submaximal exercise, as well as cardiometabolic risk markers in obese adults.
MATERIALS AND METHODS
Participants
A total of 36 middle-aged (41.6±8.3 years) overweight or obese (BMI, 28.3±3.9 kg/m2; %BF, 41.1%±5%) adults (33 women and 3 men) were recruited for this study. Of these, 58.3% and 27.8% had hypercholesterolemia and hypertriglyceridemia, respectively. All participants did not engage in regular physical exercise (>1 time/wk) and all had been at a stable weight (±3 kg) for at least 6 months prior to the study. Participants were excluded if they had a history of type 2 diabetes, coronary heart disease, peripheral vascular disease, uncontrolled hypertension, or if they were taking chronic medications known to affect energy homeostasis. We also excluded participants who had amid screening, been observed for a clinical hypothyroidism, or elevated liver enzymes. The study protocol was conducted according to the Declaration of Helsinki and approved by the Kasetsart University Research Ethics Committee (COA61/084). Sample size was based on the ability to detect a large effect (1.3) according to a previous report by Solomon et al. (2008). As a consequence, it was decided upon to require 80% power at 0.05 significance. Thus, having at least 11 participants in each group was required to complete the study.
Study design
Randomized placebo-controlled trial was undertaken with participants blinded from test results to reduce experimental bias. After screening, all participants were matched for age, gender, BMI, and %BF and randomly assigned into three groups: (1) a placebo control (CON, n=12, 91.7% female), (2) an Eri silkworm pupae ingestion group (ERI, n=12, 91.7% female), and (3) a combined concurrent training and Eri silkworm pupae ingestion group (CBT-ERI, n=12, 91.7% female). Participants’ characteristics are presented in Table 1.
The CON participants followed study procedures similarly to those in the intervention groups to ensure they did not know they were in the CON. All groups were asked to consume a snack bar twice a day. The snack bars were the same shape, color, and odor. The snack bars in the CON contained no Eri silkworm pupae, while the snack bars in the others contained 5 g of Eri silkworm pupae per day (approximately 2.5 g of linolenic acid). In addition, only the CBT-ERI participants performed 60-min of concurrent training 3 days per week. All participants were asked to maintain their habitual activity levels besides the interventions throughout the experimental period. They were requested to maintain food intake i.e., the same intake levels as preceding study outset. Nutrition logs were monitored to keep track of subjects’ dietary intake. Participants completed baseline measurements over one week before attending an initiation supervised exercise session at the Sports Science fitness center. Measurements were conducted at the cardiometabolic laboratory at the Faculty of Sports Science, Kasetsart University for blood sample collection, anthropometrics, body composition, FAO at rest and during exercise as well as energy expenditure, and heart rate variability (HRV) at baseline, and following the 8-week interventions.
Preparation of Eri silkworm pupae snack bars
Eri silkworm pupae snack bars were provided by Kasetsart Agricultural and Agro-Industrial Product Improvement Institute, Kasetsart University. The macronutrient profile of the Eri silkworm pupae snack bar was identical in composition and designed to contain 19 g of carbohydrate, 3 g of protein, and 5 g of fat. Each bar consisted of linolenic acid (approximately 4.17 g/100 g), leucine (3.77 mg/100 g), isoleucine (2.22 mg/100 g), and valine (2.90 mg/100 g), with a total sugar content of 26.67 g/100 g. The nutrition facts and the total fatty acid percentage in Eri snack bar are presented in Table 2. The placebo was prepared with a total energy amount equal to that of the Eri silkworm pupae snack bar.
Exercise intervention
The concurrent training program was carried out over three sessions a week, for 60 min per session. The exercise sessions included a 10-min warm-up with stretching followed by 40 min of concurrent (aerobic and resistance) exercise, and 10 min of stretching and cool-down exercises. The training program was designed according to the studies reviewed (Bartlett et al., 2011; Gibala et al., 2012; Kang and Ratamess, 2014). The training program was assessed the content validity by three experienced strength-training professionals. The content validity of the training program was good with index of item-objective congruence at 0.80. Each training session was supervised by experienced trainers. The exercise intensity was monitored using a HR monitoring (H10, Polar electro Inc., Kempele, Finland) to ensure exercise consistency and safety. In the warm-up and the cool-down phases, participants performed stretching of the major muscle groups for 10 min. Each stretch was sustained for between 15 and 30 sec to the point of tightness, and repeated 3 times.
Amid each session, the aerobic exercise was executed first, followed by a 30-sec rest interval prior to starting the resistance exercises (REs). The aerobic exercise consisted of 4-min low impact movement patterns including side-taps with punches to the side, leg curls with the elbows pulled back, knee-ups with raised arms, and rocking side to side with the arms raised. Aerobic intensity was maintained at between 70% and 80% of heart rate reserve.
REs were performed using an elastic band and subjects’ BW. Participants were instructed to move through the full range of motion for each exercise. In session RE1, subjects performed two REs (bicep curls and lateral pull-downs) 2 sets of 8–12 repetitions. Sets and exercises were separated by 30-sec rest intervals of active recovery. The exercises were completed at volitional speeds with subjects instructed to expire in the concentric phase, and inspire in the eccentric phase of the exercises. Detailed instructions were provided prior to the exercise sessions, although subjects were all experienced in resistance training. In sessions RE2, RE3, and RE4, the same aerobic exercise protocol was applied, though the REs were performed over two sets of 8–12 repetitions amid two exercises for each session according to the following order: shoulder press and squats, triceps extensions and lunges, push-ups, and planking, respectively.
Anthropometrics and body composition measurements
BW was measured via an electronic scale (Filizzola PL 150, Filizzola Ltda, São Paulo, Brazil). Height was measured minus shoes using a standard stadiometer (Health o Meter Professional, Sunbeam Products Inc., Boca Raton, FL, USA). BMI was calculated as weight divided by height squared. Waist circumference was measured from the midway between the lower rib margin and the iliac crest at the end of inspiration utilizing a flexible and inextensible measuring tape (Hoechstmass Balzer GmbH, Sulzbach, Hessen, Germany). Hip circumference was also measured at the level of trochanter major, with waist-to-hip circumference (W/H) ratio also calculated. Body composition and fat distribution were measured employing a DEXA scanner (Lunar iDXA, V17 software, GE Healthcare, Little Chalfont, Buckinghamshire, UK). Outcome variables were %BF, fat-free mass, FM, and fat distribution. All measurements were conducted in a climate-controlled temperature room according to the standard operating procedures recommended by the manufacturer.
Blood samples and analysis
Venous blood samples for biochemical analyses were taken in standardized fasting conditions in the mornings between 7:00 and 9:00 a.m. before and after intervention. Serum samples were stored frozen at −80°C until analyzed. Serum concentrations of glucose, total cholesterol (TC), high-density lipoprotein cholesterol (HDL-C), and triglyceride (TG) were analyzed via the automated analyzer (Thermo Fischer Scientific Inc., Waltham, MA, USA). Low-density lipoprotein cholesterol (LDL-C) was calculated using the Friedewald equation (Friedewald et al., 1972). Plasma concentrations of high-sensitive C-reactive protein (hs-CRP) were determined by an immunophelometric assay (BioTécnica Indústria e Comércio Ltda., Minas Gerais, Brazil). Serum fasting insulin concentrations were analyzed via the immunoassay analyzer (Siemens Healthcare diagnostics, Mannheim, Germany). The homeostasis model assessment of insulin resistance (HOMA-IR) index was calculated as (fasting insulin concentration×fasting glucose concentration)/22.5 (Matthews et al., 1985). Serum leptin was measured utilizing ELISA (DuoSet, R&D Systems, Minneapolis, MN, USA). These methods are routinely employed at the Department of Pathology, Faculty of Medicine Ramathibodi Hospital, Mahidol University. All measurements were performed following 12-hr fasting at baseline and 7 days after the last training session to minimize any acute effects of exercise.
Indirect calorimetry measurements
Resting energy expenditure was measured via indirect calorimetry using a canopy method (Vmax Encore metabolic cart, Vyaire Medical Inc., Yorba Linda, CA, USA), calibrated according to the manufacturer’s instructions prior to each use. Succeeding an overnight fast, participants were measured under standardized conditions in the morning between 6.00 and 10.00 a.m. (da Rocha et al., 2006). Upon arriving at the laboratory, participants rested for 20 min prior to the test, and adopted a relaxed position between testing. Expired air was collected to measure rates (L/min) of oxygen consumption (VO2) and carbon dioxide production (VCO2). Five min of steady-state data were included in the analysis and calculated for respiratory quotient and resting energy expenditure. Steady state is defined as a time period in which the mean VO2 and VCO2 vary by less than 10%. Absolute resting energy expenditure (kcal/day) was then calculated by applying the Weir equation (Weir, 1949).
Energy expenditure was also measured during submaximal exercise using metabolic cart. At least 1 week after the peak oxygen consumption (VO2peak) assessment, participants completed submaximal exercise on a treadmill (T-2100 Treadmill, GE Medical Systems, Wauwatosa, WI, USA); the first 3 min were performed at a speed of 2 mph at 0% gradient, and the consecutive 10 min were performed at a relative speed equivalent to 40% and 60% of VO2peak. Expired air was collected from 3 to 5 min, and 7 to 10 min to confirm steady-state. The VO2 and VCO2 (L/min) were used to calculate FAO (g/min) via the Peronnet and Massicotte equation (Peronnet and Massicotte, 1991): FAO=1.695 VO2–1.701 VCO2. Accordingly, FAO was expressed as g/day, kcal/day, and percentage of energy expenditure derived from fat (%) at rest, and g/min during submaximal exercise. Energy expenditure was expressed as kcal/day at rest, kcal/min during submaximal exercise, and per kilogram of BW, and fat-free mass. In addition, all participants replicated the percentage of macronutrient content of a 3-day food record completed prior to the baseline submaximal exercise test to control for effects of macronutrient content on substrate oxidation.
HRV recordings and analysis
The R-R intervals were recorded using a 5-min electrocardiogram (ECG) recording (eMotion Faros device, Mega Electronics, Kuopio, Finland) in the lying position. The ECG recording was collected online at a sampling rate of 1,000 Hz, in real time and stored on a computer. The ECG recording took place at a fixed time in the morning (between 8:00 and 10:00 a.m.) to avoid possible circadian influences on autonomic function. Prior to the recording, participants rested comfortably in the supine position for at least 20 min in a quiet, thermoneutral (23°C–25°C) room. Respiratory rate, determined by visual inspection of chest movement, was within the normal range (12–20/min).
The R-R intervals were analyzed via a software program using the recommendations of the Task Force of the European Society of Cardiology as well as the North American Society of Pacing and Electrophysiology (1996). Time- and frequency-domain parameters together with nonlinear components of HRV were calculated. The time-domain parameters consisted of mean R-R intervals, standard deviation of normal R-R intervals (SDNN), and squared differences between adjacent normal N-N intervals (RMSSD). The frequency-domain parameters consisted of very low-frequency power (VLF power 0.001–0.04 Hz), low-frequency power (LF power: 0.04–0.15 Hz), and high-frequency power (HF power: 0.15–0.4 Hz). For the frequency-domain analysis, VLF power spectrum could be an indicator of sympathetic thermoregulatory and metabolic energy signaling (Fujibayashi et al., 2009; Nagai et al., 2005). Nonlinear HRV components, Poincaré plot standard deviation perpendicular the line of identity (SD1) and along the line of identity (SD2), were analyzed quantitatively by calculating the standard deviations from the R-R interval data.
Statistical analysis
Results were expressed as mean and standard deviation. Normality was assessed by employing the Shapiro–Wilk test. Baseline comparisons between groups were performed using one-way analysis of variance. Baseline values were employed as covariates. If necessary, the data were transformed logarithmically prior to analysis of covariance (ANCOVA) in order to fulfill the criterion of normal distribution. Besides that, measurement outcomes were tested to determine whether they met the assumptions of normality, linearity, and homogeneity of variance. Outcome variable comparisons between groups were performed through ANCOVA measures. Pairwise comparisons were performed by applying the Bonferroni test. Within-group analyses were carried out with dependent t-test. The effect size (ES) was calculated between each pair of measurements according to Cohen (1988). Pearson’s correlation was applied to assess the relationships between fluctuations in energy expenditure, FAO and HRV variables following adjustment for baseline values as a confounding factor. Statistical significance was set at P<0.05. Statistical analyses were conducted by employing IBM SPSS Statistics ver. 26.0 (IBM Co., Armonk, NY, USA).
RESULTS
Subjects’ characteristics were not significantly different between groups. All groups had similar profiles amid all clinical parameters examined (see Table 1). Average energy intake during the experiment did not vary significantly among groups. Mean energy intakes of the ERI and the CBT-ERI were 1,871±360 and 1,884± 228 kcal/day at baseline, and 1,920±423 and 1,877±483 kcal/day at the conclusion of the interventions, respectively; the corresponding data of the CON was 1,811±270 kcal/day and 1,826±294 kcal/day. Carbohydrates provided approximately 51%; fat approximately 30%; and protein approximately 19% of participants’ daily energy intake in all groups. These percentages did not alter prior to and post experimentation. The levels of habitual physical activity besides the interventions did not change significantly over time, and no difference was observed between groups. Exercise attendance of the CBT-ERI was 85.4%±5%. For exercise sessions, participants completed 99%±2.6% of the prescribed exercise duration and exercised at 96.9%±7.4% of the prescribed exercise intensity throughout the training period. There were no apparent side effects induced by the Eri silkworm pupae throughout the study.
Anthropometrics and body composition at baseline and following the interventions are demonstrated in Table 1. No significant differences were observed amid any anthropometrics and body composition after the intervention in the CON. In the ERI, waist circumference (−3.2%, ES=0.27, P<0.05) and hip circumference (−2.2%, ES=0.22, P<0.05) were significantly reduced following the intervention, with no significant differences among groups. What’s more, there were no significant differences in terms of body composition and fat distribution compared to baseline following the intervention.
The CBT-ERI rendered reductions in BW (−2.4%, ES=0.28, P<0.05), BMI (−2.9%, ES=0.26, P<0.01), %BF (−3.5%, ES= 0.22, P<0.05), FM (−6.1%, ES=0.37, P<0.01), arm (−4.7%, ES= 0.40, P<0.05), leg (−2.5%, ES=0.16, P<0.05), trunk (−2.4%, ES=0.34, P<0.05), gynoid (−4.2%, ES=0.30, P<0.05), and android (−9.3%, ES=0.22, P<0.05) FM, waist circumference (−5.1, ES=0.77, P<0.01), hip circumference (−2.1%, ES=0.54, P<0.05), and W/H ratio (−3%, ES=0.20, P<0.05) following the intervention. Moreover, trunk and gynoid FM in the CBT-ERI were significantly lower than in the CON (ES=0.15, P<0.05 and ES= 0.09, P<0.05 for trunk and gynoid FM, respectively) as well as the ERI (ES=0.02, P<0.05 and ES=0.16, P<0.05 for trunk and gynoid FM, respectively) following intervention (Table 1).
Table 1 indicates the results for cardiometabolic risk markers at baseline and post interventions. No significant variances were observed in leptin, HDL-C concentrations, TC/HDL-C ratio, and LDL-C/HDL-C ratio following the interventions in all groups. Succeeding the interventions, the CON exhibited significant increments in fasting blood glucose (11.8%, ES=0.63, P<0.01), insulin (26.4%, ES=0.57, P<0.05), HOMA-IR (41.3%, ES=0.67, P<0.05), and LDL-C (14.9%, ES=0.47, P<0.05) concentrations, though with no significant dissimilarities among groups. The ERI exhibited significant increments in fasting blood glucose (19.1%, ES=0.36, P<0.01), insulin (36.6%, ES=0.69, P<0.05), HOMA-IR (63.2%, ES=0.66, P<0.01), TC (9.7%, ES=0.34, P<0.05), TG (40.4%, ES=0.55, P<0.05), and LDL-C (14.9%, ES=0.59, P<0.01) concentrations, and reduction in hs-CRP concentration (−26.2%, ES=0.46, P<0.05) following the interventions, yet with no significant differences among groups.
Just the CBT-ERI brought about reductions in hs-CRP concentration of 26.1% (ES=0.75, P<0.05) and TC concentration of 10.6% (ES=0.72, P<0.01) following the interventions. Moreover, hs-CRP concentration (ES=0.25, P<0.05) in the CBT-ERI was significantly lower than the ERI following the experimentations. TC concentration in the CBT-ERI was significantly lower than the CON (ES=0.66, P<0.01), as well as the ERI (ES=0.43, P<0.01) following the experimentations. What’s more, there were no significant differences in fasting blood glucose, insulin, HOMA-IR, TG, LDL-C, and HDL-C concentrations compared to baseline following the intervention (Table 1).
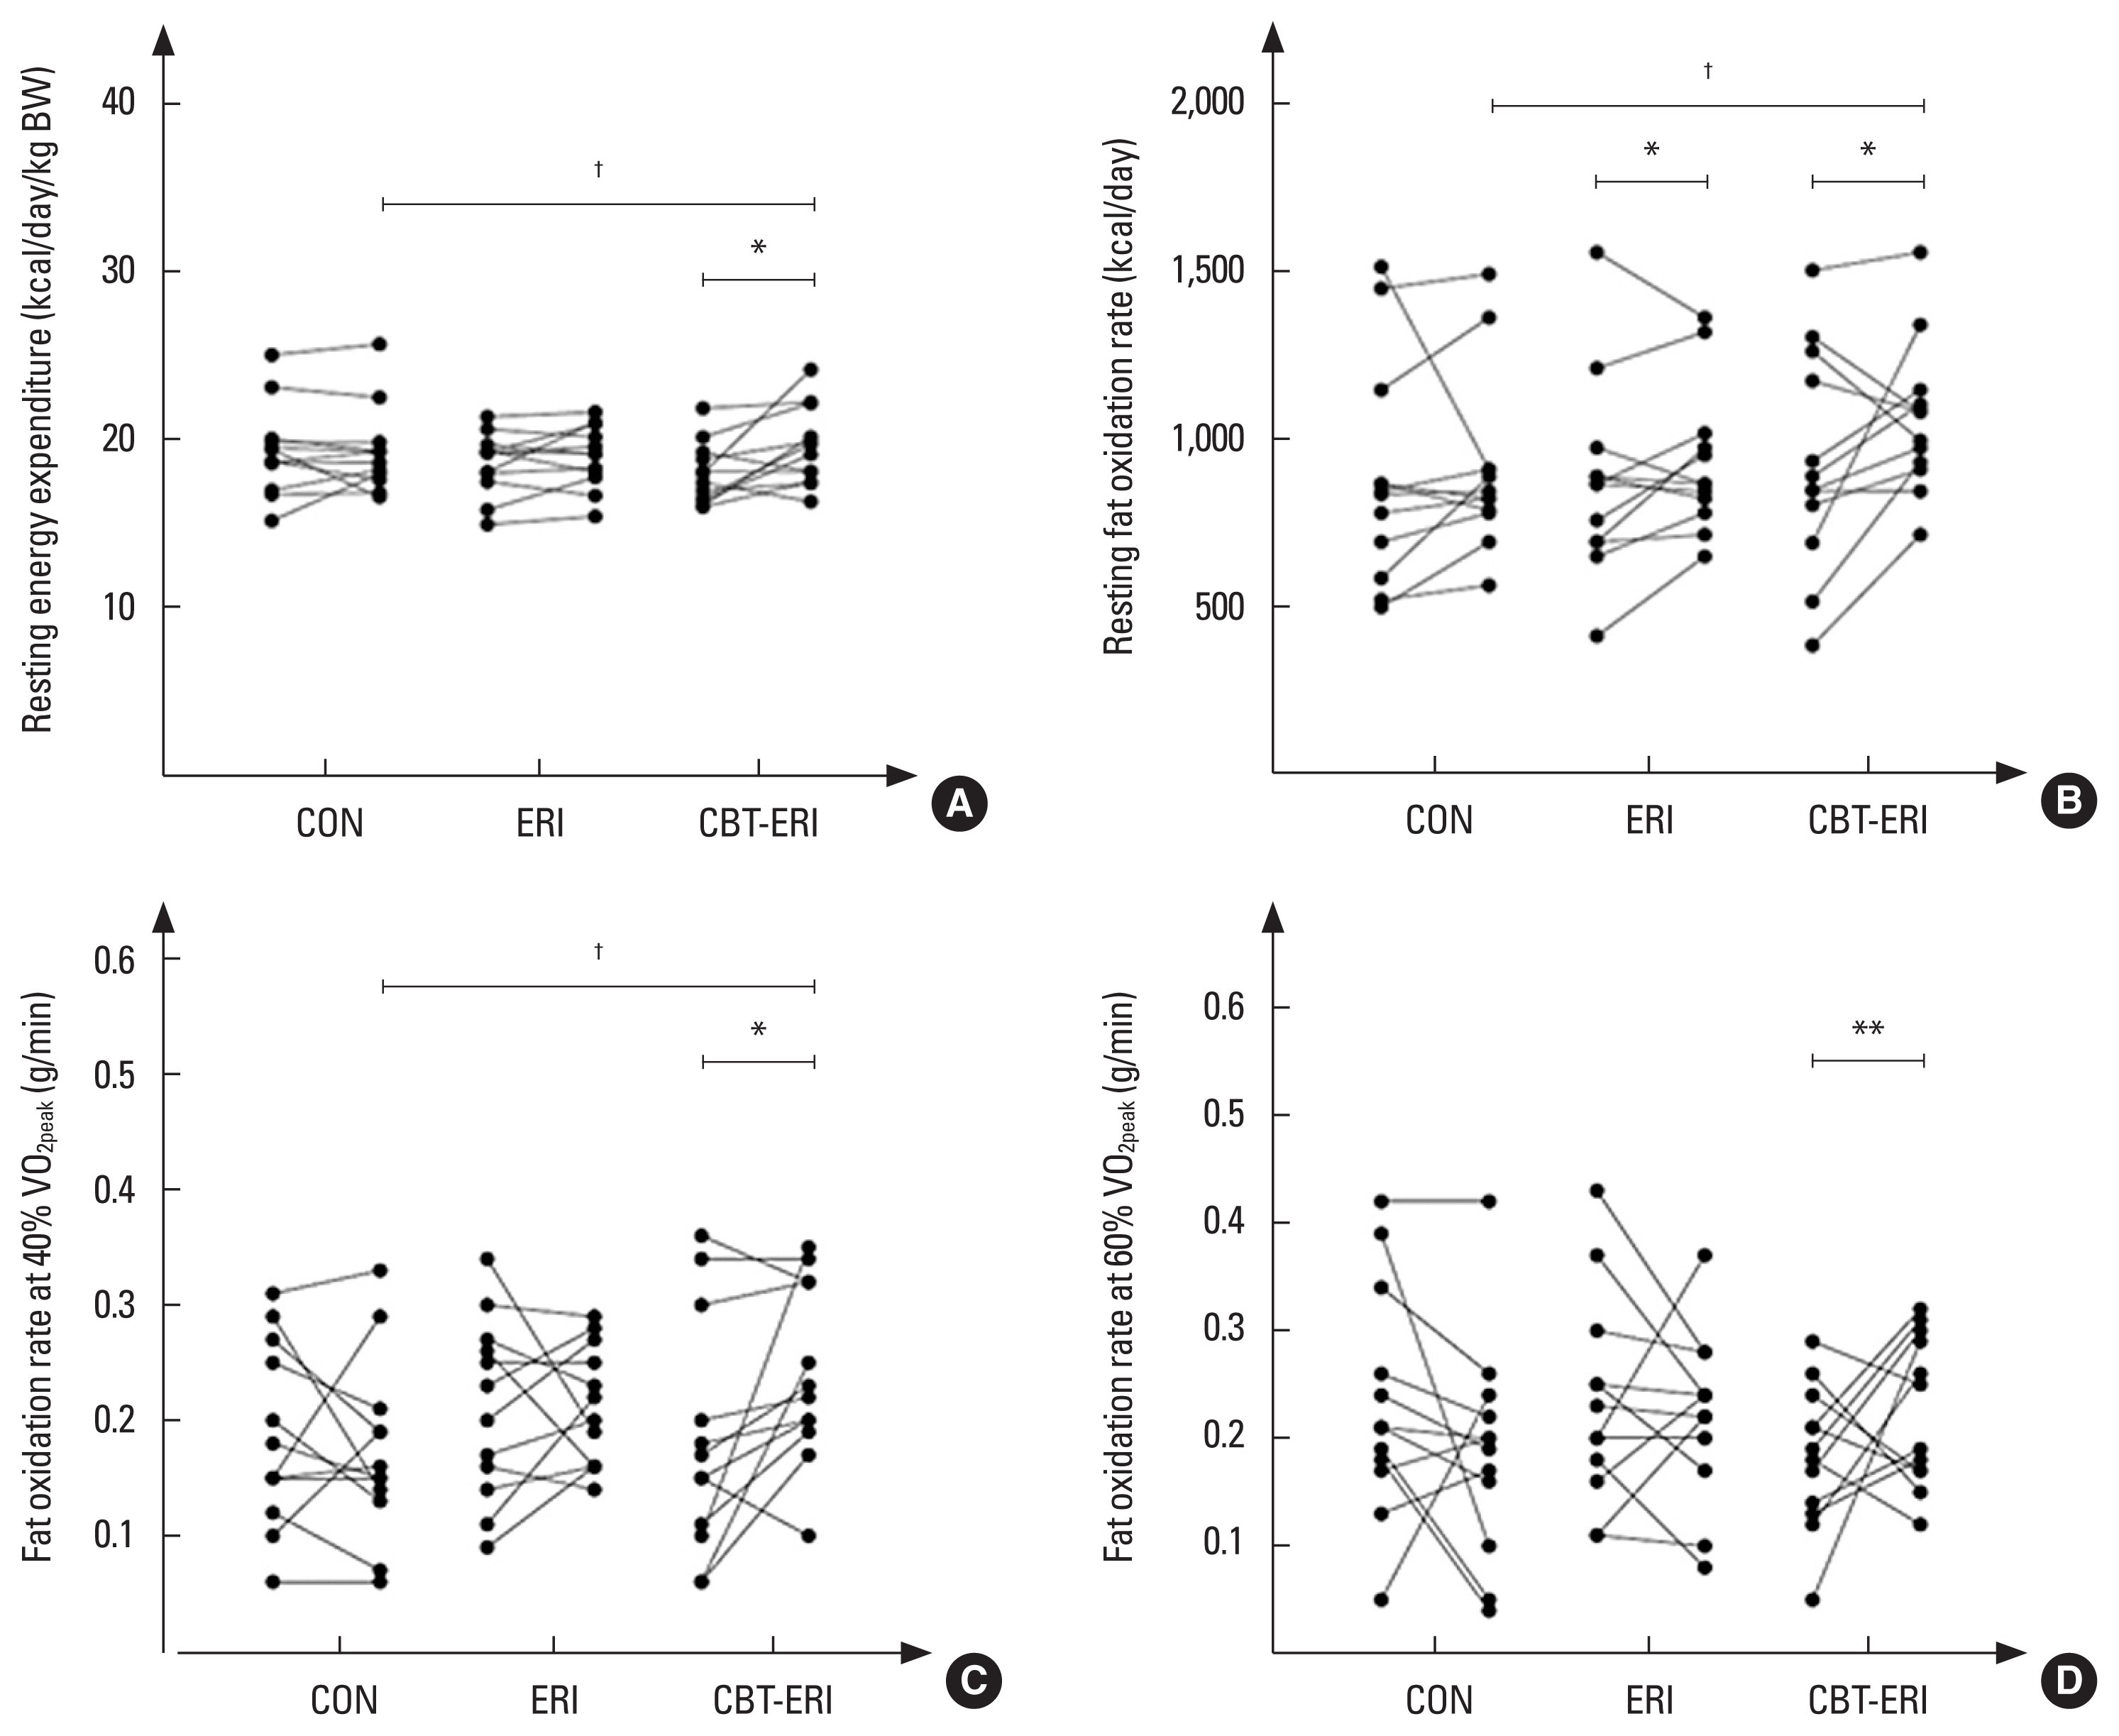
Table 3 indicates the results for energy expenditure and FAO at rest and during submaximal exercise following the interventions. No significant variances were detected in energy expenditure and FAO at rest and during submaximal exercise following the intervention in the CON. In the ERI, resting FAO was significantly increased (11.5%, ES=0.23, P<0.05) succeeding the intervention, though with no significant differences among groups. There were no significant differences in resting energy expenditure, energy expenditure, and FAO during submaximal exercise compared to baseline following the experimentation.
Just the CBT-ERI brought about increments in resting energy expenditure (kcal/day/kg BW) (7.8%, ES=0.78, P<0.05), resting FAO (24.5%, ES=0.45, P<0.05), FAO during submaximal exercise at an intensity of 40% of VO2peak (72.7%, ES=0.60, P<0.05) and 60% of VO2peak (60.4%, ES=0.60, P<0.01), and reduction in RER (−3.5%, ES=0.60, P<0.05) during submaximal exercise at an intensity of 60% of VO2peak following the intervention. Moreover, resting energy expenditure in the CBT-ERI was significantly higher than the CON (ES=0.08, P<0.05) post experimentations. FAO at rest and during submaximal exercise at an intensity of 40% of VO2peak in the CBT-ERI were significantly higher than the CON (ES=0.62, P<0.05 and ES=0.70, P<0.05, respectively) post experimentations (Fig. 1). However, there were no significant differences in energy expenditure during submaximal exercise compared to baseline following the intervention (Table 3).
HRV variables at baseline and succeeding the interventions are demonstrated in Table 4. No significant differences were observed in any HRV variables after the intervention in the CON; except for VLF power. VLF power (−6.9%, ES=0.77, P<0.05) was significantly lower in the CON compared to baseline, with no noteworthy differences among groups. Succeeding the interventions, the ERI exhibited a significant increment in lnVLF power (14.6%, ES=1.38, P<0.05) compared to baseline. Moreover, the increment in lnVLF power (ES=1.17, P<0.01) was significantly greater compared to the CON following the interventions. However, there were no significant differences in term of time-domain and nonlinear variables of HRV compared to baseline following the intervention.
Only the CBT-ERI brought about increments in SDNN (58.3%, ES=0.97, P<0.01), pNN50 (423.8%, ES=1.06, P<0.01), and lnVLF power (8.3%, ES=0.63, P<0.05) following experimentation. Furthermore, SDNN (ES=1.14, P<0.01), pNN50 (ES=0.87, P<0.05), and lnVLF power (ES=0.88, P<0.01) in the CBT-ERI were significantly greater than the CON following the interventions. SDNN (ES=0.79, P<0.05) in the CBT-ERI was also significantly greater than the ERI following the interventions. However, there were no significant differences in term of nonlinear variables of HRV compared to baseline following the intervention (Table 4).
The increment of relative resting energy expenditure (kcal/day/kg BW) in the CBT-ERI was positively related to the change in rate of FAO (kcal/day) at rest (r=0.643, P=0.001) and during submaximal exercise (g/min) at an intensity of 40% of VO2peak (r=0.435, P=0.034), and lnVLF power (r=0.421, P=0.045) (Fig. 2A); meanwhile, the increment of relative resting energy expenditure was negatively related to the alteration in BMI (r=−0.526, P=0.008) and TC concentration (r=−0.411, P=0.046) following the intervention. The increment of resting FAO in the CBT-ERI was positively correlated with the alteration in SDNN (r=0.409, P=0.047) and lnVLF power (r=0.448, P=0.028) (Fig. 2B) succeeding the intervention. Nevertheless, the association with the increment of resting FAO in the ERI did not reach statistical significance following the intervention.
DISCUSSION
The hypothesis of this study was that the combination of concurrent training with Eri silkworm pupae intake could improve resting energy expenditure, FAO at rest and during submaximal exercise, as well as cardiometabolic risk markers in overweight and obese adults. The primary findings were that Eri silkworm pupae ingestion alone induced significant modifications in resting FAO and lnVLF power band of HRV. Adding three weekly sessions of concurrent training to this approach delivers better outcomes than Eri silkworm pupae ingestion alone; not only the modifications in resting FAO and lnVLF power band of HRV, but also resting energy expenditure and FAO during submaximal exercise were also increased.
Moreover, the results demonstrated the significant relationship among resting energy expenditure, FAO, and lnVLF power band of HRV following 8 weeks of the combined intervention. What’s more, our results demonstrated a favorable impact of combined concurrent training and Eri silkworm pupae intake on trunk and gynoid FM, corresponding to an adaptation of both resting energy expenditure and FAO at rest and during submaximal exercise. For overweight and obese individuals an increased energy expenditure and FAO may be beneficial in order to reduce BW.
Very little is known about the role of combined concurrent training and Eri silkworm pupae intake with respect to energy expenditure and FAO at rest and during exercise. The majority of studies conducted to date have focused on concurrent training alone (Schwingshackl et al., 2013) or PUFAs supplementation alone (Fujibayashi et al., 2009; Kien et al., 2005; Nagai et al., 2005; Piers et al., 2002). Improvements in energy expenditure and/or FAO after a high ratio of PUFAs to saturated fatty acids ingestion have previously been reported (Kien et al., 2005; Piers et al., 2002). Eri silkworm pupae are enriched with PUFAs accounting for approximately 70% of the total fatty acids (Longvah et al., 2012). Our findings are consistent with previous studies (Fujibayashi et al., 2009; Nagai et al., 2005) whereby they reported the same effects of PUFAs ingestion on resting energy expenditure and FAO. The previous studies suggested that PUFAs ingestion might affect resting energy expenditure and FAO via activated sympathetic thermogenesis. An augmentation of sympathetic thermogenesis seems to be a part of an energy regulation system which burns excessive energy in the mode of heat production.
Moreover, the VLF power band of HRV has been introduced as an indicator of sympathetic thermoregulatory and metabolic energy signaling (Millis et al., 2011). Our results also indicated the significant increase in resting FAO and lnVLF power following Eri silkworm pupae intake. Nevertheless, according to our revelations, the correlation between resting FAO and lnVLF power in the ERI did not reach statistical significance. Thus, the increase in resting FAO post Eri silkworm pupae intake may be achieved via other mechanisms such as faster gastric emptying (Robertson et al., 2002), increased intestinal absorption, and preferential hepatic oxidation (DeLany et al., 2000). Peculiarly, PUFAs have been shown to be effective in up-regulating PPARα expression, and stimulating the transcription of genes involved in FAO and thermogenesis while suppressing the genes regulating fatty acid synthesis (Kliewer et al., 1997).
What’s more, our findings indicate that the combined intervention delivers better outcomes than Eri silkworm pupae ingestion alone. Hence, a noteworthy statistical correlation among resting energy expenditure, FAO, and lnVLF power in the CBT-ERI succeeding the combined intervention was observed. A possible mechanism responsible for increased resting energy expenditure and FAO at rest and during exercise in the CBT-ERI may be an improved sympathetic thermogenesis as the important statistical correlation among resting energy expenditure, FAO, and lnVLF has been detected.
Another possible mechanism may be related to improved parasympathetic activity. The present study demonstrated that the CBT-ERI brought about increases in vagal-related HRV parameters (SDNN and pNN50). A noteworthy statistical correlation between increased resting FAO and SDNN was also observed. Vagal activity plays an important role in the regulation of caloric-intake behavior and metabolic homeostasis. Moreover, an increase in vagal activity relates to the thermic effect of food. In obese individuals, the reductions of both sympathetic and vagal activity have been reported to be linked with low resting energy expenditure and high body fat (Messina et al., 2017). The modulation of both sympathetic and vagal activities provides a complex homeostatic mechanism enabling the regulation of energy balance (Villarroya and Vidal-Puig, 2013).
In addition, our results showed that FAO during submaximal exercise increased in only the CBT-ERI with no change in the ERI. The combined concurrent training and Eri silkworm ingestion have positive effects on lowering RER value during submaximal exercise (60% of VO2peak) indicating an increase in FAO. Increased FAO during exercise can be associated with the ability of skeletal muscles to mobilize and oxidize free fatty acids as well as the activity of pyruvate dehydrogenase and glycogenolysis (Yeo et al., 2011).
Taking all the above results into account, it is thought that PUFAs contained in large quantities in the Eri silkworm pupae, especially linolenic acid, can inhibit fat storage by accelerating fat catabolism. Moreover, the combination of concurrent training and Eri silkworm pupae ingestion may conceivably suppress obesity via an increase in resting energy expenditure through a significant increase in FAO at rest and during exercise. This suggests that concurrent training together with Eri silkworm pupae intake could generate synergistic effects enhancing resting energy expenditure and FAO at rest and during submaximal exercise among obese adults. Improvements to resting energy expenditure and FAO are essential due to their significant roles in reducing cardiometabolic risk factors (Rosenkilde et al., 2010).
As for body composition, we also discovered that a combined intervention is more effective than Eri silkworm pupae ingestion alone, in terms of reducing BW, BMI, %BF, FM, especially trunk and gynoid FM, waist circumference, hip circumference, and W/H ratio. Besides that, we discovered a significant correlation between resting energy expenditure and BMI in the CBT-ERI. The favorable impact of the combined interventions on BMI and body fat corresponds to an adaptation of both resting energy expenditure and FAO at rest and during submaximal exercise. On the other hand, the ERI did not change in body composition. This is consistent with the lack of increased resting energy expenditure. These findings also indicate that trunk and gynoid FM were effectively modified by the combined intervention. More marked reductions of these fat areas in the CBT-ERI showed a greater effect of the combined intervention on subcutaneous adipose tissue. Such remarkable observed reductions can be explained as an outcome of increased resting energy expenditure.
As for lipid profiles, noting that our participants did not change their caloric intake through the study, only a reduction in TC concentration was observed in the CBT-ERI. Our results demonstrate that the improvements in TC are directly related to the increase in resting energy expenditure. Hence the results clearly show that combined concurrent training and Eri silkworm pupae ingestion attenuate hypercholesterolemia more effectively than intake of Eri silkworm pupae alone. Attenuation of hypercholesterolemia by the combined intervention may be attributed to the improvement of cardiometabolic risk factors in obese adults.
Regarding inflammatory markers, hs-CRP, which is a surrogate marker of global vascular health, decreased in both the ERI and the CBT-ERI. Reduction in hs-CRP level has been reported to be associated with exercise training as well as dietary PUFAs (Ortega et al., 2016; Tartibian et al., 2011). A reduction in hs-CRP level in metabolic syndrome patients was reported following a combination of exercise training and PUFAs ingestion (Ortega et al., 2016). Similarly, a previous study reported that the levels of proinflammatory cytokines in postmenopausal women were decreased after a combined exercise training and PUFAs supplementation (Tartibian et al., 2011). Furthermore, we discovered the significant correlation between reduction in hs-CRP levels and BW, BMI, waist circumference, and W/H ratio following the combined intervention. Consistent with our findings, a previous study has suggested that the change in hs-CRP correlated similarly with changes in BW and all measures of body fat, including total body fat, and total abdominal, subcutaneous abdominal, and visceral fat (Fisher et al., 2011).
There are some study limitations to be considered. In this particular study design, there was no concurrent training group, thus signifying a lack of trained control groups. Furthermore, the assessment of sympathetic and parasympathetic activities through spectral analysis of HRV only, should be interpreted with caution. Although, the association between the fluctuations in resting energy expenditure, FAO, and lnVLF power were detected, the correlation coefficient is weak. Further investigations on the possible energy expenditure-promoting effects of the combined intervention are recommended. Finally, our study incorporated a low number of subjects which stands as a significant limitation. Thus, it is possible that a larger sample size could result in more precisely yielded effects and outcomes amid intervention. Hence, in terms of future researches, such studies ought to be addressed with a larger study population.
In conclusion, this study demonstrates that concurrent training together with dietary Eri silkworm pupae for 8 weeks leads to an increased resting energy expenditure and FAO at rest and during submaximal exercise, as well as reduced trunk and gynoid FM. Although Eri silkworm pupae ingestion did not directly affect body composition, it may augment the effects of concurrent training on body fat by increasing resting FAO. The combined concurrent training and Eri silkworm pupae intake have additional favorable effects on blood cholesterol and inflammatory marker. These results suggest that the combined interventions of concurrent training and dietary Eri silkworm pupae may prevent or lessen obesity and possibly reduce the risk of cardiometabolic disease.