INTRODUCTION
Gait is one of the main subjects in various fields, such as rehabilitation, sports medicine, and special physical education, for health management and quality of life improvement. Nevertheless, the gait study makes it difficult to analyze the similarity of gait patterns, such as determining normal gait or classifying gait patterns, because gait patterns vary not only among individuals but also within individuals.
So, researchers proposed the dynamic time warping (DTW) algorithm to solve the difficulty of analysis (Dot et al., 2020; Gaspar et al., 2017; Lee, 2019; Miodonska et al., 2016; Shokoohi-Yekta et al., 2017). Furthermore, the DTW algorithm initially developed to test the similarity of voice signals by Velichko and Zagoruyko (1970) is known to be used not only for time series data with different lengths but also for evaluating the similarity of nonlinear patterns. Due to these advantages, DTW has been widely used when comparing and analyzing time series data in various academic fields, such as electromyography and electrocardiogram analysis, online sign recognition, image analysis, and motion pattern recognition (Gong et al., 2022; Jia et al., 2019; Landmesser, 2021; Mao et al., 2017; Park et al., 2009). Moreover, since much of the data dealt with in gait research is in the form of time series, related researchers have been studying methods of applying DTW to gait analysis (Engelhard et al., 2016; Ghersi et al., 2020; Jeong and Baek, 2021; Lee, 2019). The reason for applying DTW to the gait study is that the evaluation methods (symmetry index, autocorrelation, etc.) of similarity of gait patterns used in the past did not correctly reflect changes in data length, amplitude, and time-shift phenomena. So then, researchers have suggested DTW as a way to compensate for these disadvantages. Barth et al. (2015) and Gaspar et al. (2017) reported the effectiveness of DTW for gait research, and Lee (2019) reported that statistical analysis would be possible by applying DTW to gait data. Also, applying DTW to gait within individuals, Jeong and Baek (2021) analyzed gait imbalance. However, studies are insufficient in classifying gait patterns among groups such as gender and age by applying DTW. Suppose it is proved that DTW can be used not only for individual analysis but also for group difference analysis and classification analysis. In that case, it would be more actively used in gait research.
Generally, the normalization of the optimal warping path in DTW uses a method that divides the global cost of optimal warping paths by the sum of the lengths of elements of two sequences. This method makes it possible to compare optimal warping paths for the same variables. However, mutual comparison between variables with different scales or range of motion (ROM) is impossible. For compensate the limitation of classic normalization, this study used a normalization method that uses perpendicular distance (root mean square error [RMSE]) from indices of the optimal warping path to the diagonal line accepted as an ideal path instead of the global cost. Since the RMSE presented in this study indicates the degree to which the optimal warping path is away from the diagonal, it has the advantage of comparing variables measured with different scales and ROM. Therefore, this study will verify differences in gait patterns between genders, gender classification performance, and the usefulness of the RMSE.
MATERIALS AND METHODS
Participants and 3-dimensional motion analysis experiment
Three-dimensional (3D) motion analysis experiment was performed with 24 healthy adults (male=12, female=12) in their 20s of age without gait-related diseases or injuries for the past six months to collect gait data. All subjects participated in the experiment voluntarily and signed the consent form after being informed of the contents and purpose of the experiment (IRB approval No: KUIRB-2021-0250-02, Korea University, Seoul, Korea). A 3D motion capture system made by MotionAnalysis Corp. (Rohnert Park, CA, USA) was used with ten infrared charge-coupled devise cameras operated by 120 frames/sec sampling frequency. Participants attached 41 reflective markers to their bodies and walked the 10-m walking path prepared in the laboratory with their self-selected normal walking. Results of Table 1 shows the anthropometric data of participants. Kinematic variables for the hip joint, the knee joint, and the ankle joint were calculated by Cortex and OrthTrak software provided by MotionAnalysis Corp.
DTW programming
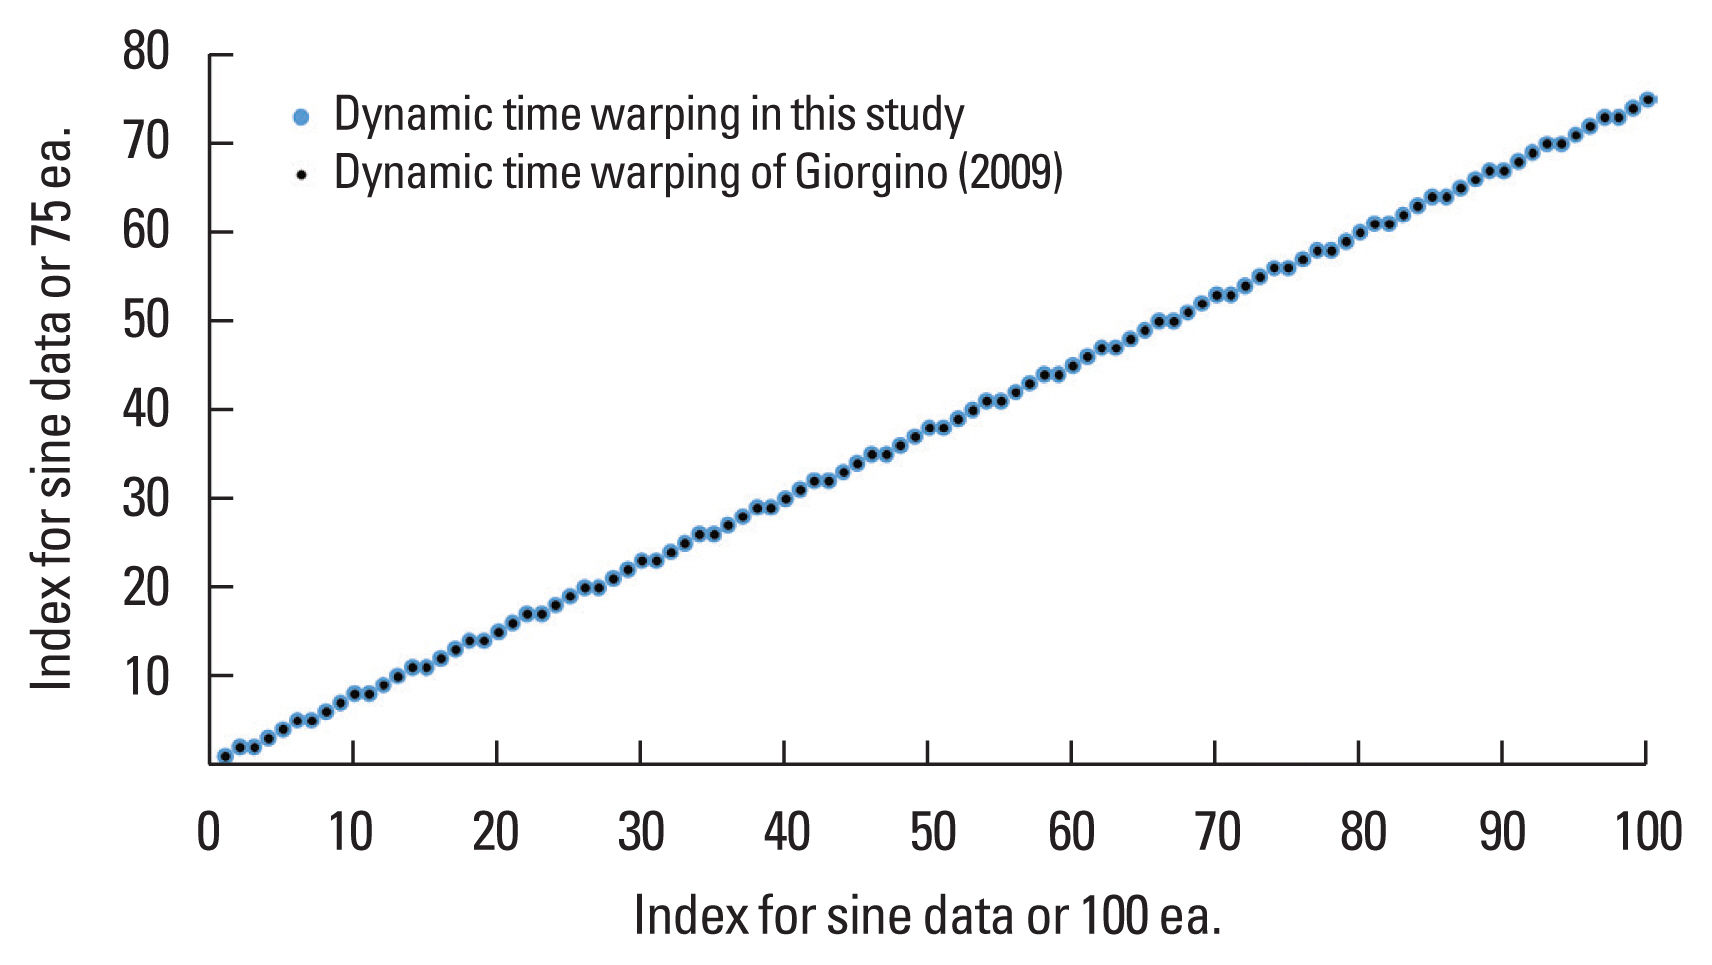
DTW program was developed by R-language for calculating the RMSE represented a perpendicular distance from an index of the warping path to the diagonal line accepted as an ideal path and for calculating the statistical variables such as mean and standard deviation In order to test whether DTW was operating normally, DTW was performed with 100 and 75 data extracted at equal intervals from the sine cycle and confirmed by comparing the results of the DTW program with the results manually calculated. In addition, the execution result of Giorgino’s (2009) DTW program, provided as a package in the R, was consistent with the DTW program in this study developed (Fig. 1). The warping path of DTW can be limited using various global constraints, but this study not used global constraints to confirm the natural match of sequences.
Analysis methods
This study calculated the flexion angle of the right leg’s hip, knee, and ankle joints, representing a gait pattern well in the gait cycle. Then, the global cost and RMSE of the optimal warping paths were calculated and normalized after performing DTW, respectively, for males and females to these variables. Therefore, DTW was performed 132 times in total (male=62, female=62). The normalization method of the optimal warping path was used as a general method of dividing the global local cost by the sum of two sequence sizes and a method divided by the diagonal length of the cost matrix. In addition, the mean of RMSE was calculated. A reason divided by the diagonal of the cost matrix is that even if the sum of two sequence lengths is equal, the diagonal length of the cost matrix can be different when the length of each sequence is different. These normalization methods were applied to the global cost and the RMSE. These normalization methods were applied to not only the local cost but also the RMSE. The independent t-test between gender was performed by the Jamovi software for normalized global cost and normalized RMSE of the optimal warping paths. The statistical significance level was 0.05. Machine learning (ML) was performed to test the classification performance using the neural network, support vector machine (SVM), and logistic regression model among the supervised models. The neural network was set with 100 neurons, and the activation function was rectified linear units. The kernel of SVM was polynomial with d=3. Logistic regression used the ridge model. Training data was set to 70% of the total data.
RESULTS
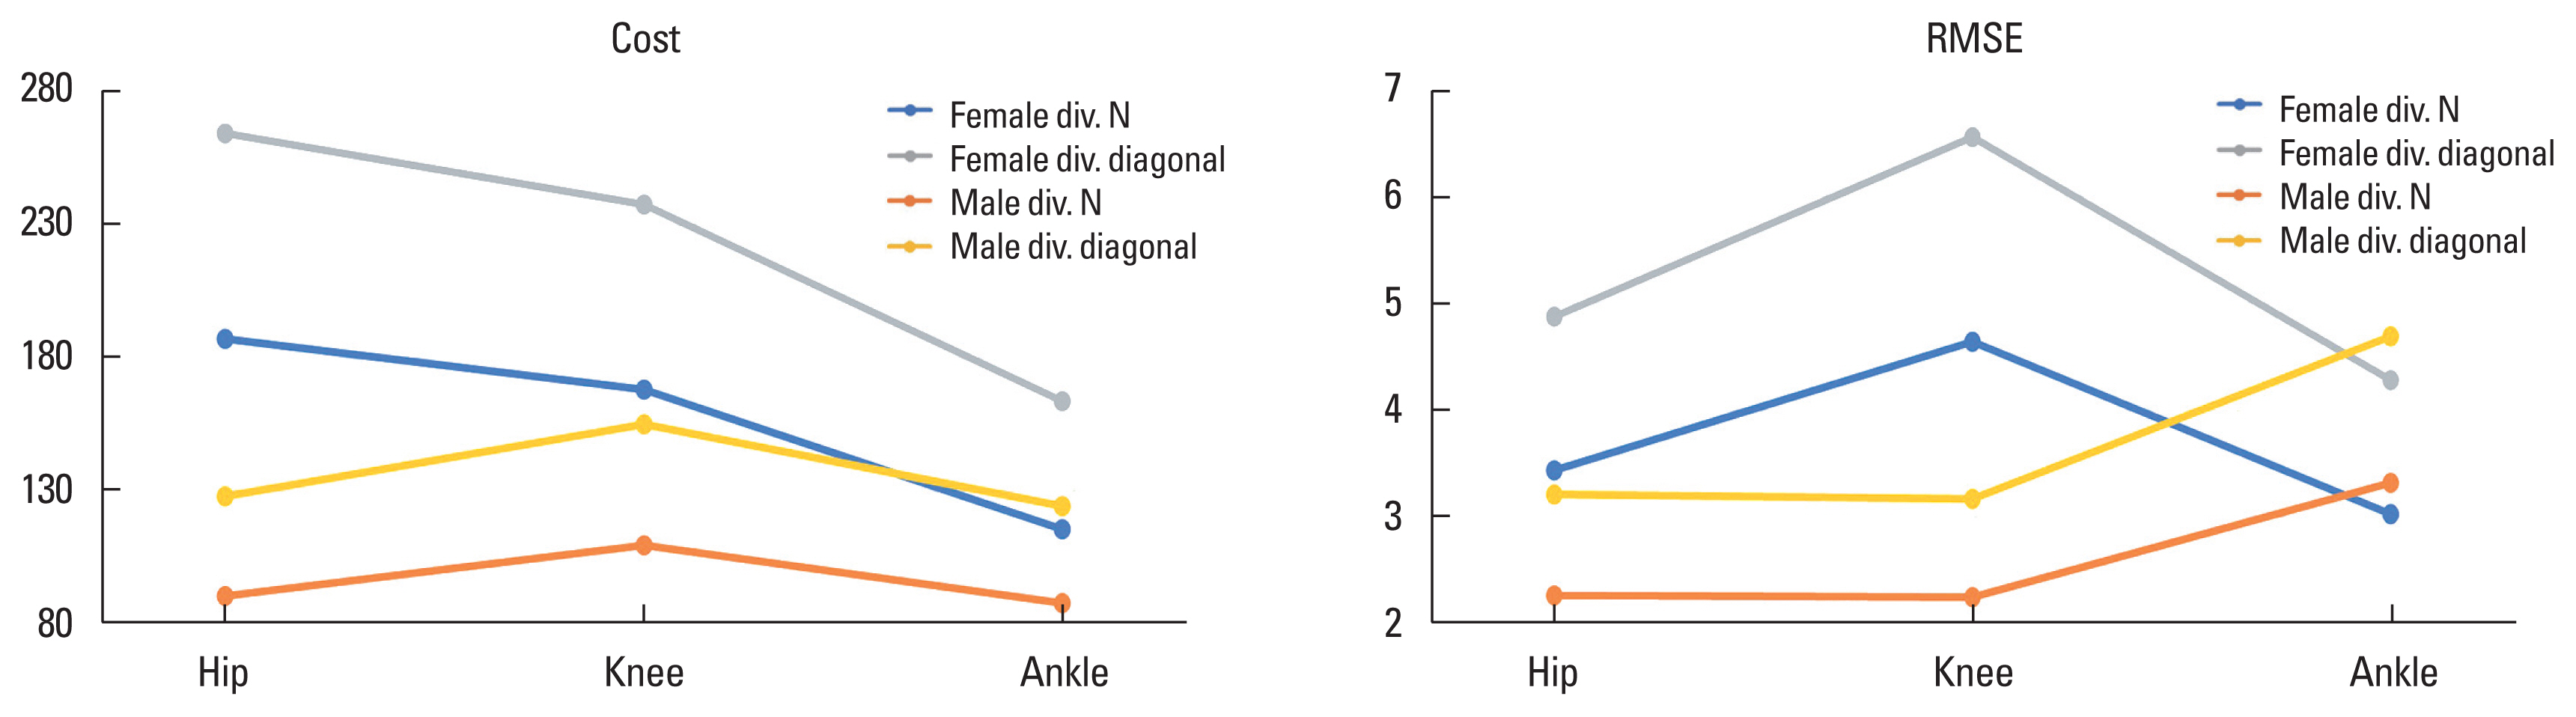
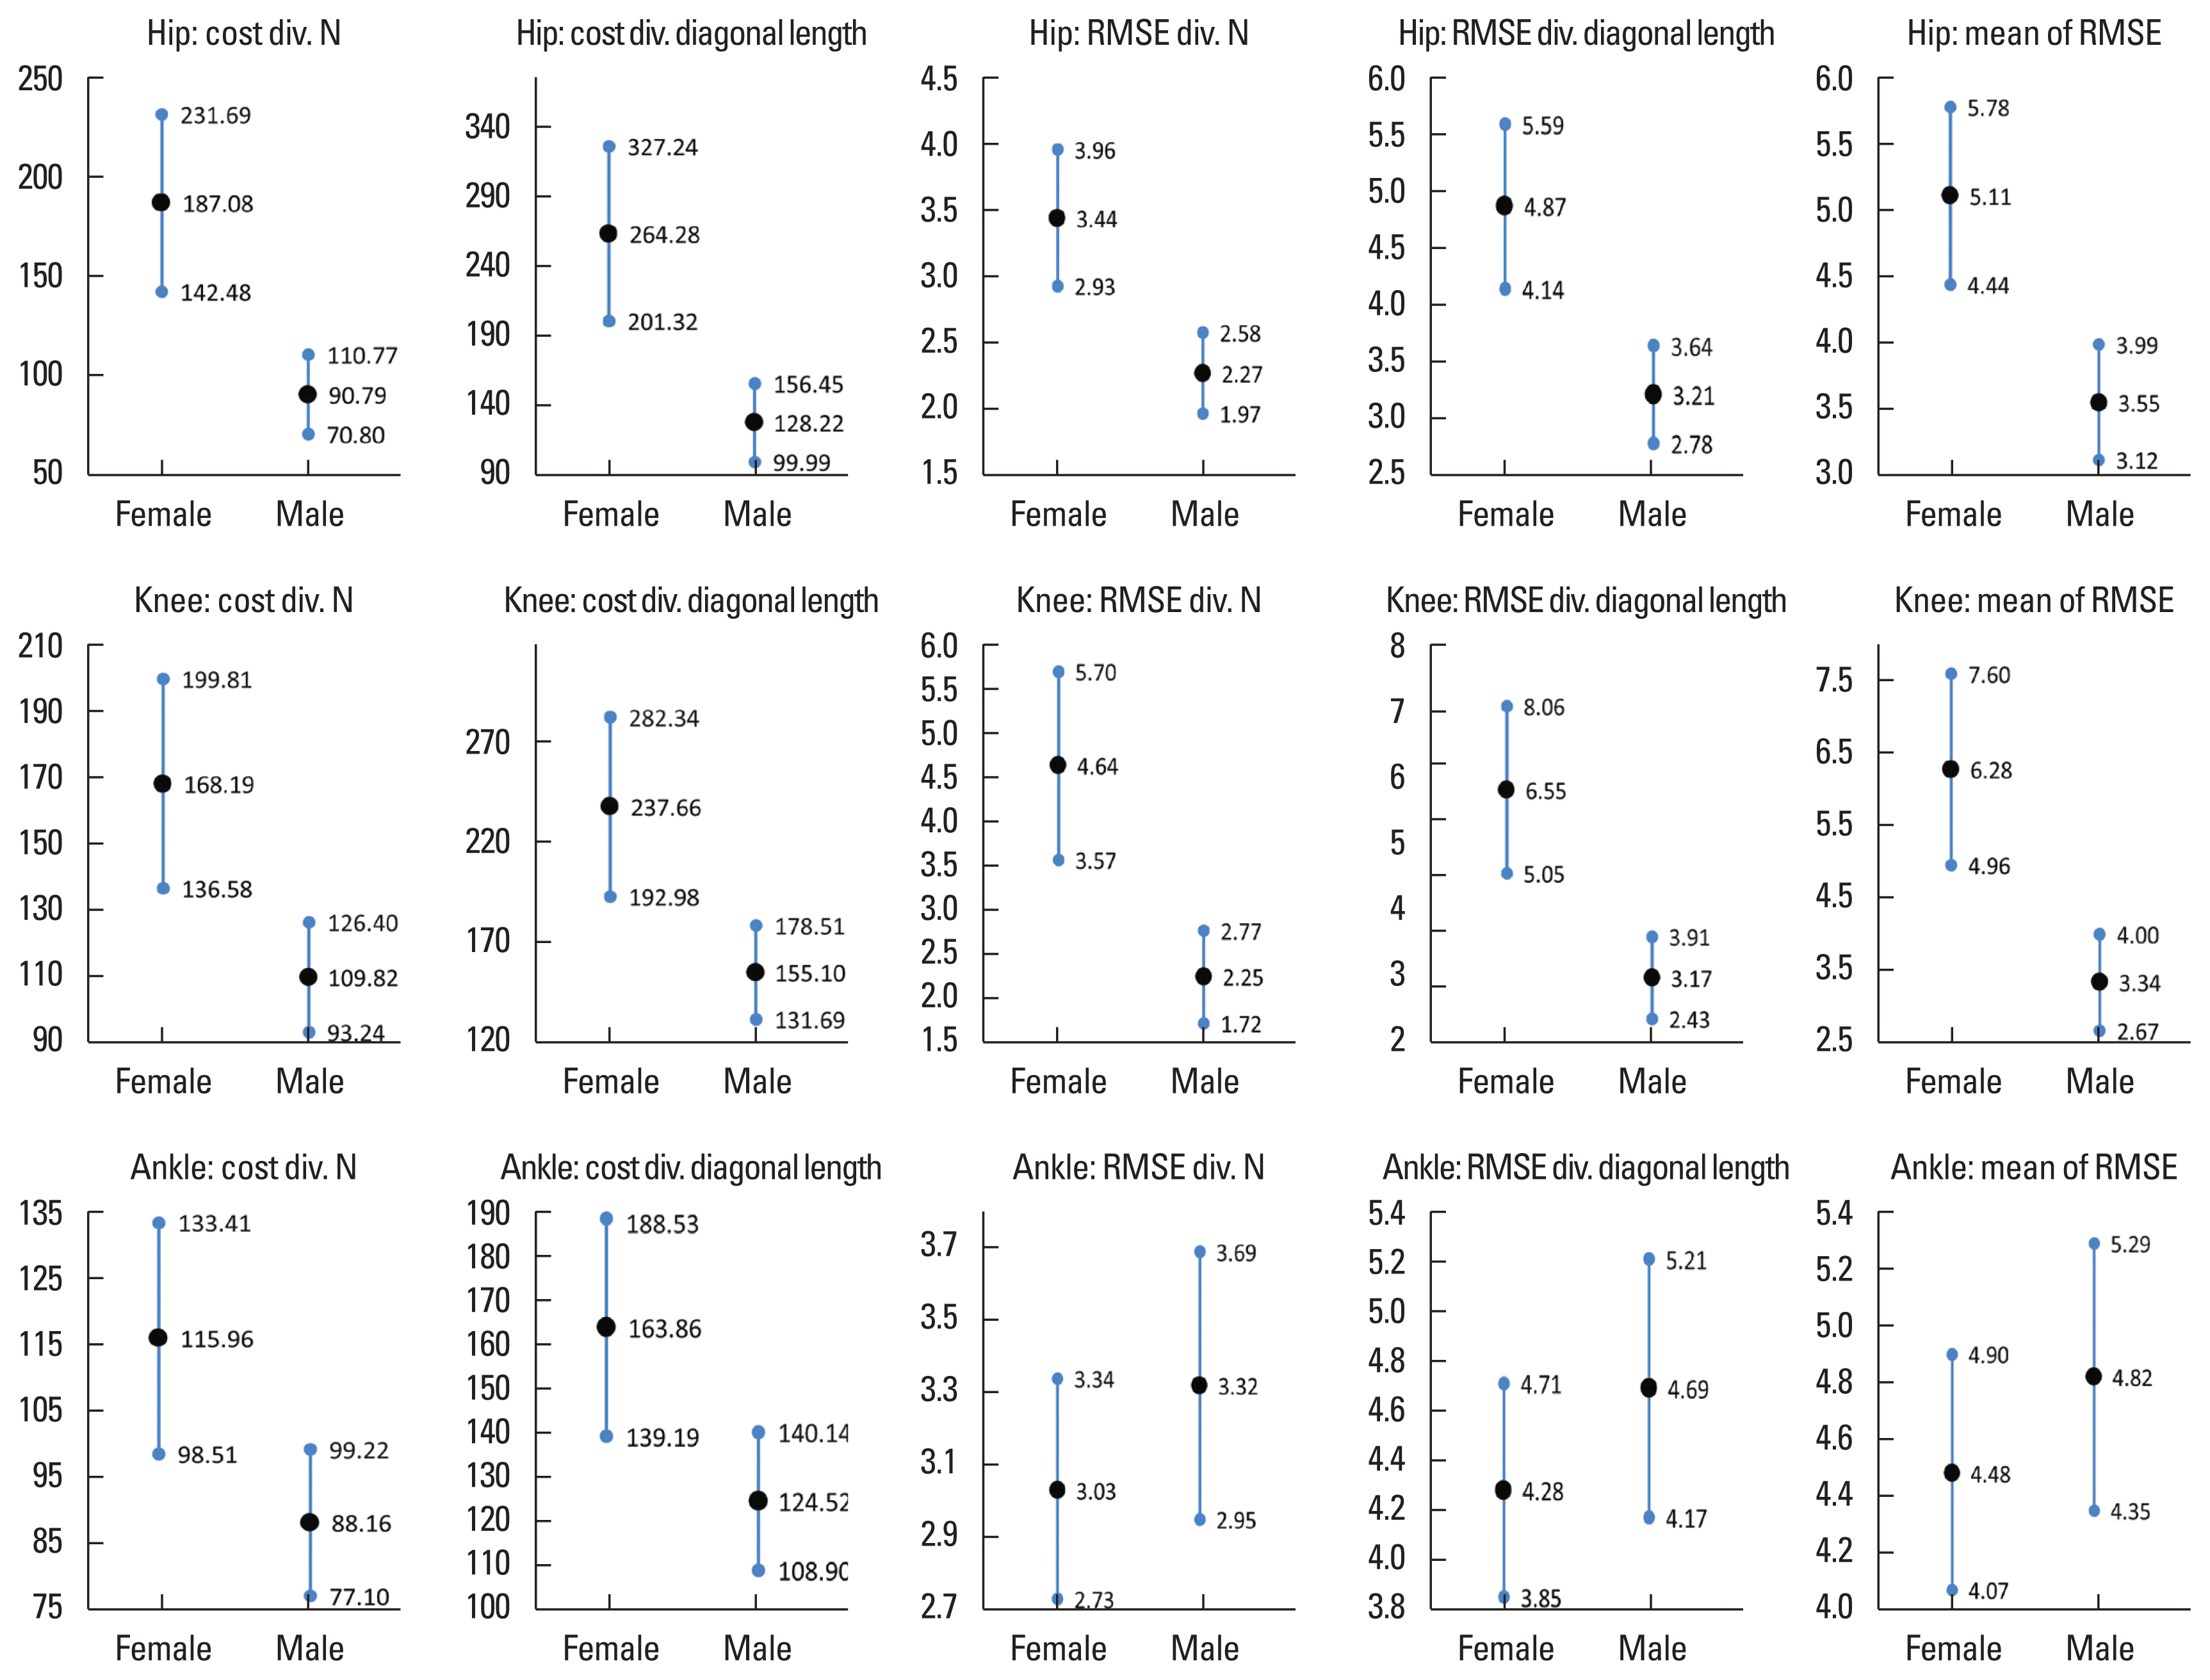
Results of Table 2 shows the results of the independent t-test between gender for each joint according to normalization methods. In the case of the cost, a statistically significant difference appeared for all joints when normalized respectively by dividing by the sum of two sequences’ lengths (N) and the diagonal length. Case of the RMSE, a statistically significant difference has not appeared at the ankle joint but has appeared differences at the hip and the knee joint like in the case cost. Also, a significant difference has not appeared at the ankle joint when using the mean of RMSE. Comparing the change of means (Fig. 2), different exist between when the cost is used and when RMSE is used and exist different between gender. Therefore, when estimating the similarity of gait patterns, Using the cost only is not appropriate. Results of Fig. 3 shows the 95% confidence interval (CI) of the mean. At the ankle joint, CI overlaps considerably between females and males. In conclusion, as the results of Table 2, Figs. 2, 3, the findings of this study indicate that the application of optimal warping paths obtained through DTW enables the difference analysis between genders using the cost sum and RMSE. Furthermore, since statistical analysis results may vary depending on whether RMSE is used, RMSE can be an important indicator for determining gait pattern similarity.
Results of Table 3 demonstrates the evaluation metrics of the classification analysis for gender using ML. Good levels appeared in both cost and RMSE. However, the results showed that it was difficult to distinguish the superiority or inferiority of performance between cost and RMSE. Comparing the models based on the leading evaluation indicators such as the area under the receiver operating characteristic curve (AUC) and F1-score, network and logistic regression are considered better than SVM. When the cost was used, neural network and logistic regression were relatively higher than SVM in evaluation metrics. When the RMSE was used, the logistic regression model was the highest on the AUC. These results demonstrate the feasibility of gender classification analysis through the application of optimal warping paths of DTW.
DISCUSSION
In this study, we demonstrated that the normalized global cost and normalized RMSE of the optimal warping path of DTW can be used for difference analysis and classification analysis in inter-gender gait analysis. Because the global cost is affected by the data values of two sequences, the normalization of classic DTW used in previous studies cannot compare among the optimal warping paths determined by the different scales and ROM. Therefore, even if the flexion angles of the joints are targeted, it is difficult to compare optimal warping paths when the flexion ranges of the joints are significantly different. On the other hand, since RMSE proposed in this study represents the perpendicular distance from the diagonal that is accepted as an ideal path, a comparison of the optimal warping path is possible not related to the data scale measured and ROM. Blazkiewicz et al. (2021) reported that statistically significant differences appeared between the barefoot and four different walker boot settings in the gait similarity study using DTW. Blazkiewicz employed a global cost in his study and constrained the ROM of the joints by the settings of the walker boot. As a result, it is natural that a statistically significant difference would be observed. If the RMSE proposed in this study was used instead of the global cost, it is possible that alternative results would be obtained for some analyses.
Results analyzed using global cost and RMSE for hip, knee, and ankle joints showed a statistically significant difference between genders in global cost and RMSE for hip and knee joints but not for ankle joints using RMSE. The reason for this phenomenon is considered to be influenced by the fact that women showed a larger ROM of the ankle joint than men (Fig. 3). On the other hand, not appearing a statistically significant difference between genders in the case of RMSE is considered because the RMSE of the optimal warping path is not affected by the ROM of the ankle joint. These results mean that the normalization method for the global cost cannot be used for comparison among the optimal warping paths. In any case, the results of this study practically prove Lee (2019)’s claim that a statistical analysis method would be possible by applying DTW to gait data.
This study verified the gender classification performance of DTW using SVM, neural network, and logistic regression among supervised classification models of ML (Table 3). In all models, AUC values appeared to range from 0.737 to 0.809, showing a good level of performance. However, in using the global cost, the F1-score (0.679) of the SVM model is lower than other models (0.740 and 0.752), so caution is needed in using the SVM model. Considering both AUC and F1-score, the logistic regression model has been evaluated as the most suitable for gender classification using the global cost or RMSE. This study showed the possibility of gender classification using the optimal warping paths based on the results of the ML. As described in the introduction, previous studies have used DTW only for within-subject or within groups comparisons (Jeong and Baek, 2021; Zhang et al., 2009), but this study demonstrated that optimal warping paths could be used for statistical difference analysis and classification analysis. Li et al. (2019) reported results similar to this study by conducting difference analysis (Mann–Whitney test) and classification analysis (k-nearest neighbor) using the global cost of DTW for 15 healthy subjects and 15 poststroke survivors. Li’s research and the results of this study indicate that classification analysis is possible using the optimal warping path of DTW. Even though this study has conducted difference and classification analysis using DTW, it is not entirely proven for all spatiotemporal, kinematic, and kinetic variables related to gait, therefore further research is necessary to continue investigating these variables. In particular, to enhance the effectiveness of classification analysis, it is necessary to achieve higher classification performance than the AUC value presented as a result of this study. Furthermore, it is essential to have reference values to determine gait similarity, but currently, there are no criteria for determining gait similarity using DTW. Therefore, research related to this should be conducted promptly. If further research utilizing DTW is conducted across various age groups as well as for comparative studies between healthy individuals and patients such as Li et al. (2021), Pulido-Valdeolivas et al. (2018), Varatharajan et al. (2018), it is probable that DTW will be utilized as a replacement for traditional indicators in the evaluation of gait pattern similarity.