INTRODUCTION
Body composition is an essential factor in a healthy body, work efficiency, and athletes’ performance. In particular, body fat is a widely known indicator of the general public because it is closely related to obesity. Excessive low or high body fat can be predicted as a sign of health risk. It has been applied to evaluate the effectiveness of nutrition and exercise intervention on improving body composition, estimate health weight for the general public and athletes, and observe dietary recommendations and exercise prescriptions, growth, development, maturity, and age-related changes (Fosbøl and Zerahn, 2015).
Today, due to the diversity and convenience of body fat measurement methods, information on individual body fat can be easily provided (Noh et al., 2007). Methods of measuring body fat include body density, skin fold method, bioelectrical impedance analysis (BIA), computed tomography (CT) scan, magnetic resonance imaging (MRI), dual energy x-ray absorptiometry (DEXA), body mass index, and the waist-hip-ratio (WHR) (Kuriyan, 2018). CT, MRI, and DEXA have advantages in measurement accuracy. However, there are practical and economic problems, such as expensive equipment requiring highly skilled personnel (Noh et al., 2007). Body mass index using height and weight has long raised the question of accuracy because it is not distinguished that body fat amounts may differ for objects with the same height and weight because it does not consider the ratio of muscle mass and fat mass (World Health Organization, 2004). Body density methods, such as underwater weight methods and BodPod, have high precision. However, the fat mass components used to convert to body composition may differ depending on factors such as age, gender, and race. In addition, these measurement methods require additional measurement of residual air in the lungs even if the subject exhales as much as possible, and are used only for laboratory purposes due to the high installation cost without the cooperation of skilled measurers and subjects (Ahn et al., 2011).
BIA estimates the body composition using the total body resistance value using the short frequency after attaching the electrocardiogram (ECG) electrodes to the arms and legs of the subject. The price of BIA equipment varies by equipment grade, and the reliability of low-grade equipment is problematic (Kim and Kim, 2001). In addition, there is a lack of evidence that it is better for predicting clinical outcomes than the fat-free mass index calculated only by human system measurement (Elia, 2013). However, the measurement method is relatively simple, fast, easy to carry, and relatively inexpensive compared to the reference measurement equipment. Recently, BIA companies have continuously supplemented the estimation formula to supplement measurement information. Due to the advantages of BIA, it is most commonly used to evaluate body composition.
Studies related to BIA have increased exponentially since 1985, and about 350 studies are being conducted annually based on PubMed searches (Ward, 2019). Although studies related to BIA are being conducted in Korea, such as nutritional evaluation and sarcopenia, public health, and obesity management in clinical patients actively studying abroad are insufficient (Earthman, 2015; Kyle et al., 2004). BIA is a technology that indirectly estimates body composition using impedance technology. Population means, algorithms, random values of coefficients used in algorithms, and impedance resistance are not applied equally to all body tissues, which increases measurement error (Geddes and Baker, 1967). In clinical patients and somatic composition-related studies, these errors can increase several errors in BIA studies and clinical applications.
In this study, the reliability of the device was evaluated for the four most commonly used BIA devices in Korea for middle-aged men and women in the age group whose clinical health indicators change negatively, and the validity was verified through comparison with DEXA, which is used as a reference standard. The purpose of this study was to provide essential data for BIA characteristics research on the middle-aged age group with high clinical significance.
MATERIALS AND METHODS
Research subject
This study recruited and conducted 58 healthy middle-aged men and women (24 men and 34 women) in an experiment. Before the start of the experiment, the purpose and procedure of the study were fully communicated to the study subjects. The subjects participated in the experiment after filling out the basic questionnaire, survey, and consent form for the primary test. To standardize the state of body composition, the study subjects were required to participate in the experiment after fasting for about 12 hours from the evening before the experiment to the morning of the laboratory. As for the progress of the experiment, four types of BIA equipment other than DEXA were continuously measured first. After the first measurement was completed, a 15-min break was provided, and the second measurement was performed. For reliability analysis, DEXA was conducted twice, considering the measurement time and the risk of subjects’ radiation exposure of subjects, and four types of BIA equipment were repeated three times in total. The physical characteristics of the study subjects are shown in Table 1.
Bioelectrical impedance analysis
The height and weight of the participants were measured using an automatic body measuring device (GL-150, G-tech international, Uijeongbu, Korea). Dual Energy X-ray Absorptiometry (Prodigy, GE Healthcare, Los Angeles, CA, USA) was used as measurement equipment that serves as a reference for body composition. For each BIA equipment, three types of domestic equipment (Inbody 770, Inbody, Seoul, Korea), (Inbalance 300, Inbalance, Seoul, Korea), (ACCUNIQ BC720, ACCUNIQ, Daejeon, Korea) and one type of foreign equipment (BC-418, TANITA, Tokyo, Japan) were used. Looking at the characteristics of each equipment, all BIA equipment uses a four-pole, eight-point touch electrode method in a multi-frequency method. The current measurement ranges from 80 μA to 500 μA, which varies by device.
Measurement of circumference
The waist circumference measurement is an area with few bones and much subcutaneous fat. This study minimized these measurement errors by maintaining an empty stomach in advance. The subjects stabilized their breathing and maintained a correct posture, so they did not get nervous. After that, the measurer measured the most entered part horizontally in terms of the height of the navel or the side of the abdomen and rounded it up at the first decimal place in cm. The pelvic circumference was measured horizontally, directly above the large protrusion (trochanter major) of the side and passing through the pubic bone in the front, by selecting the most protruding part of the measurer’s hip while maintaining the same crab posture. It was recorded by rounding off at the first place of the cm decimal point in the same way as the waist circumference.
Whole body DEXA scan
DEXA, measured as a reference standard, used dual energy X-ray absorptiometry (GE Healthcare) equipment in Korea Operations Research Laboratory. The date of birth, weight, height, and gender of the person to be measured in the dictionary was entered, the body was laid down on the table of DEXA to be aligned in an anatomical position, and the palm was facing down. Between the legs of the subject, a fixed object provided by the equipment was used to maintain a prescribed posture between measurements. The measurement time took about 10 to 15 min.
Statistical analysis
The data derived from this study were analyzed using IBM SPSS Statistics ver. 25.0 (IBM Co., Armonk, NY, USA). For the reliability analysis of this study, an interclass correlation coefficient analysis was performed on the repeated measurements of BIA and DEXA equipment. To analyze the validity, correlation analysis (Pearson) and Brand and Altman were conducted as measurements of the measurement variables calculated in the four types of reference tests, DEXA and BIA equipment. In addition, the mean absolute percentage error (MAPE) of each piece of equipment was also presented.
RESULTS
Body composition of middle-aged men and women by DEXA and BIA devices
Table 2 below shows the physical composition status of each device of four types of DEXA and BIA in middle-aged men and women aged 50 to 64. The average weight of middle-aged men is 71.0 kg based on DEXA, and the average weight of middle-aged women is 57.4 kg. The body fat rate was 25.2% for middle-aged men and 34% for middle-aged women. The average body fat weight was 17.4 kg for middle-aged men and 19 kg for middle-aged women, and the average body fat was 53.5 kg for middle-aged men and 38.4 kg for middle-aged women. In addition to DEXA equipment, four types of BIA equipment were similar to DEXA’s results, although there were slight differences.
Body composition of middle-aged men and women by DEXA and BIA devices
Table 3 shows the results of analyzing the reliability of the body composition of all BIA equipment and DEXA for middle-aged men and women aged 50 to 65. DEXA, the reference standard equipment, showed high reliability in all body fat percentages, body fat amount, and fat-free mass (r=0.999). Most of the BIA equipment also showed high reliability (r=0.900). DEXA and company B’s equipment were excluded from the results because they did not present WHR values.
Actual WHR and WHR validity by BIA device
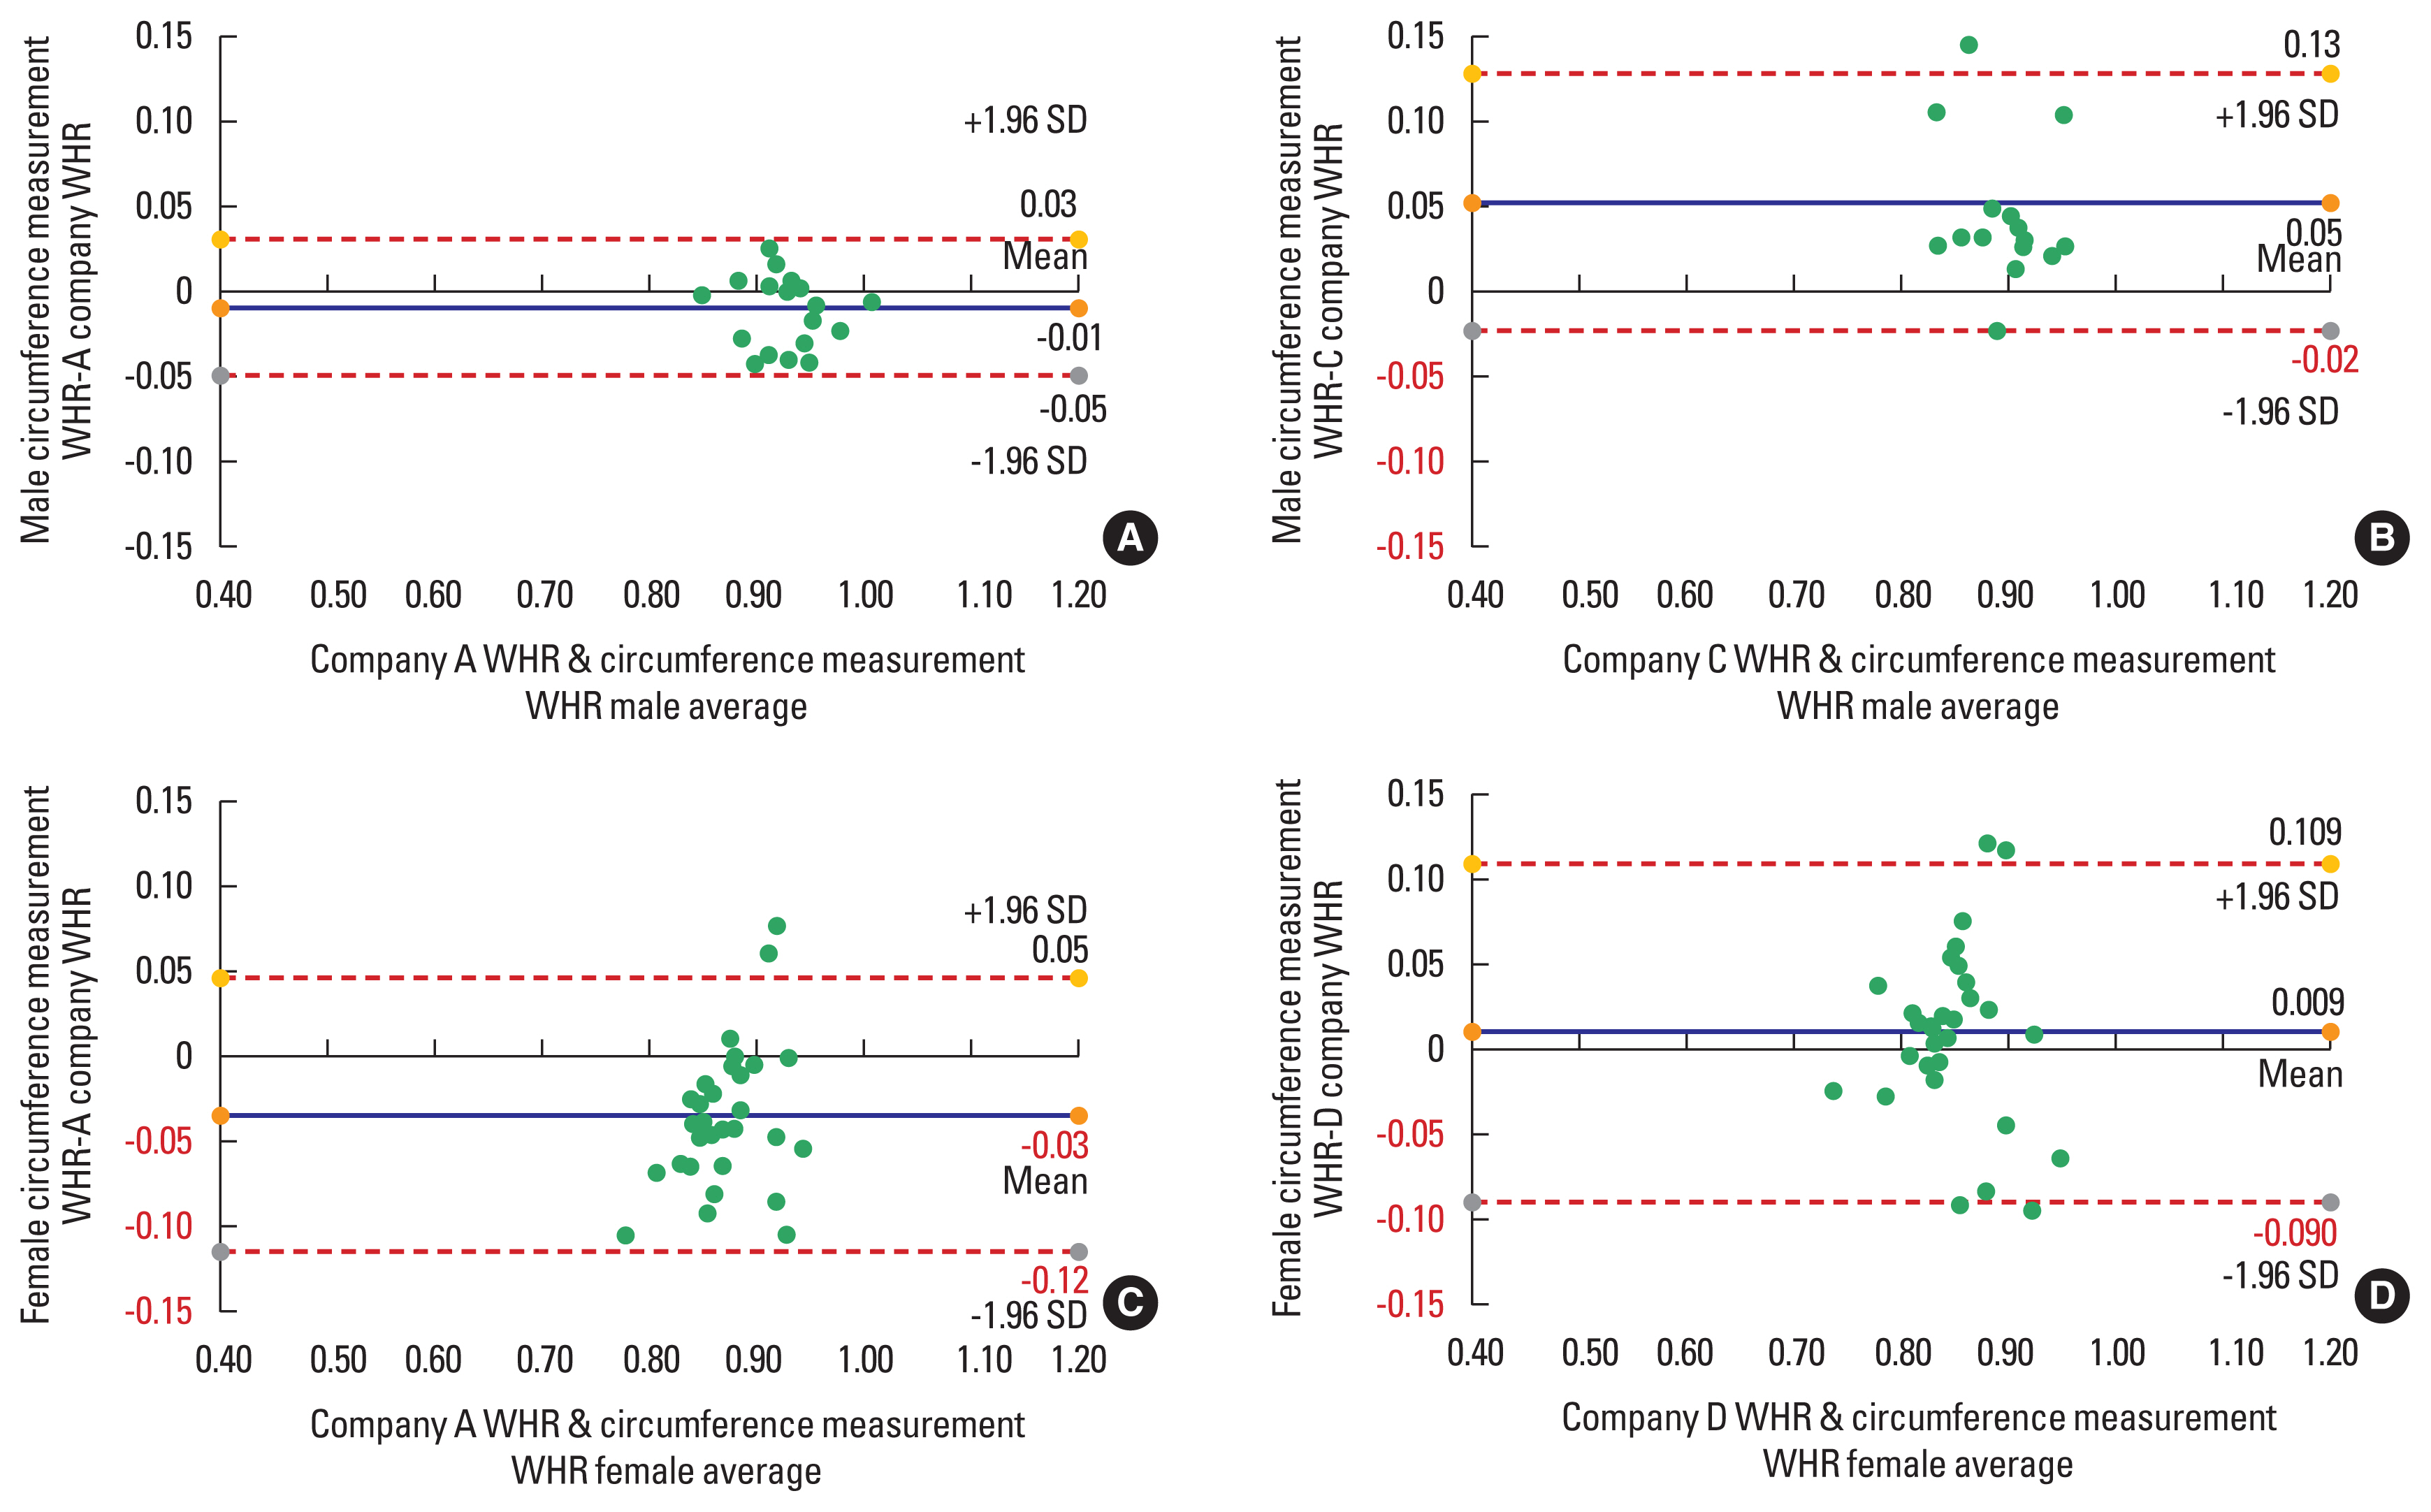
Table 4 is the result of a correlation analysis by dividing the WHR results automatically calculated by the actual waist and hip circumference measurement standard and the WHR results calculated by the BIA equipment into men and women. For middle-aged men, the company A (r=0.834) was correlated in the order of the company D (r=0.800), and company C (r=0.494), and for middle-aged women, the company A (r=0.556), company D (r=0.480), and company C (r=0.449). The company A showed a high correlation in both men and women, and the company C showed a lower correlation in both men and women compared to other BIA equipment. All three companies showed a relatively low correlation between middle-aged women and middle-aged men. According to a study by Bland and Altman (1986), which presented a consistency evaluation method using the information on absolute differences in measured values, the mean, standard deviation, confidence interval (difference point average±1.96 standard deviation) (Fig. 1). MAPE values were presented in Table 5 below to evaluate the validity of WHR values automatically calculated by each BIA equipment.
The validity of body composition by BIA device based on DEXA for middle-aged men
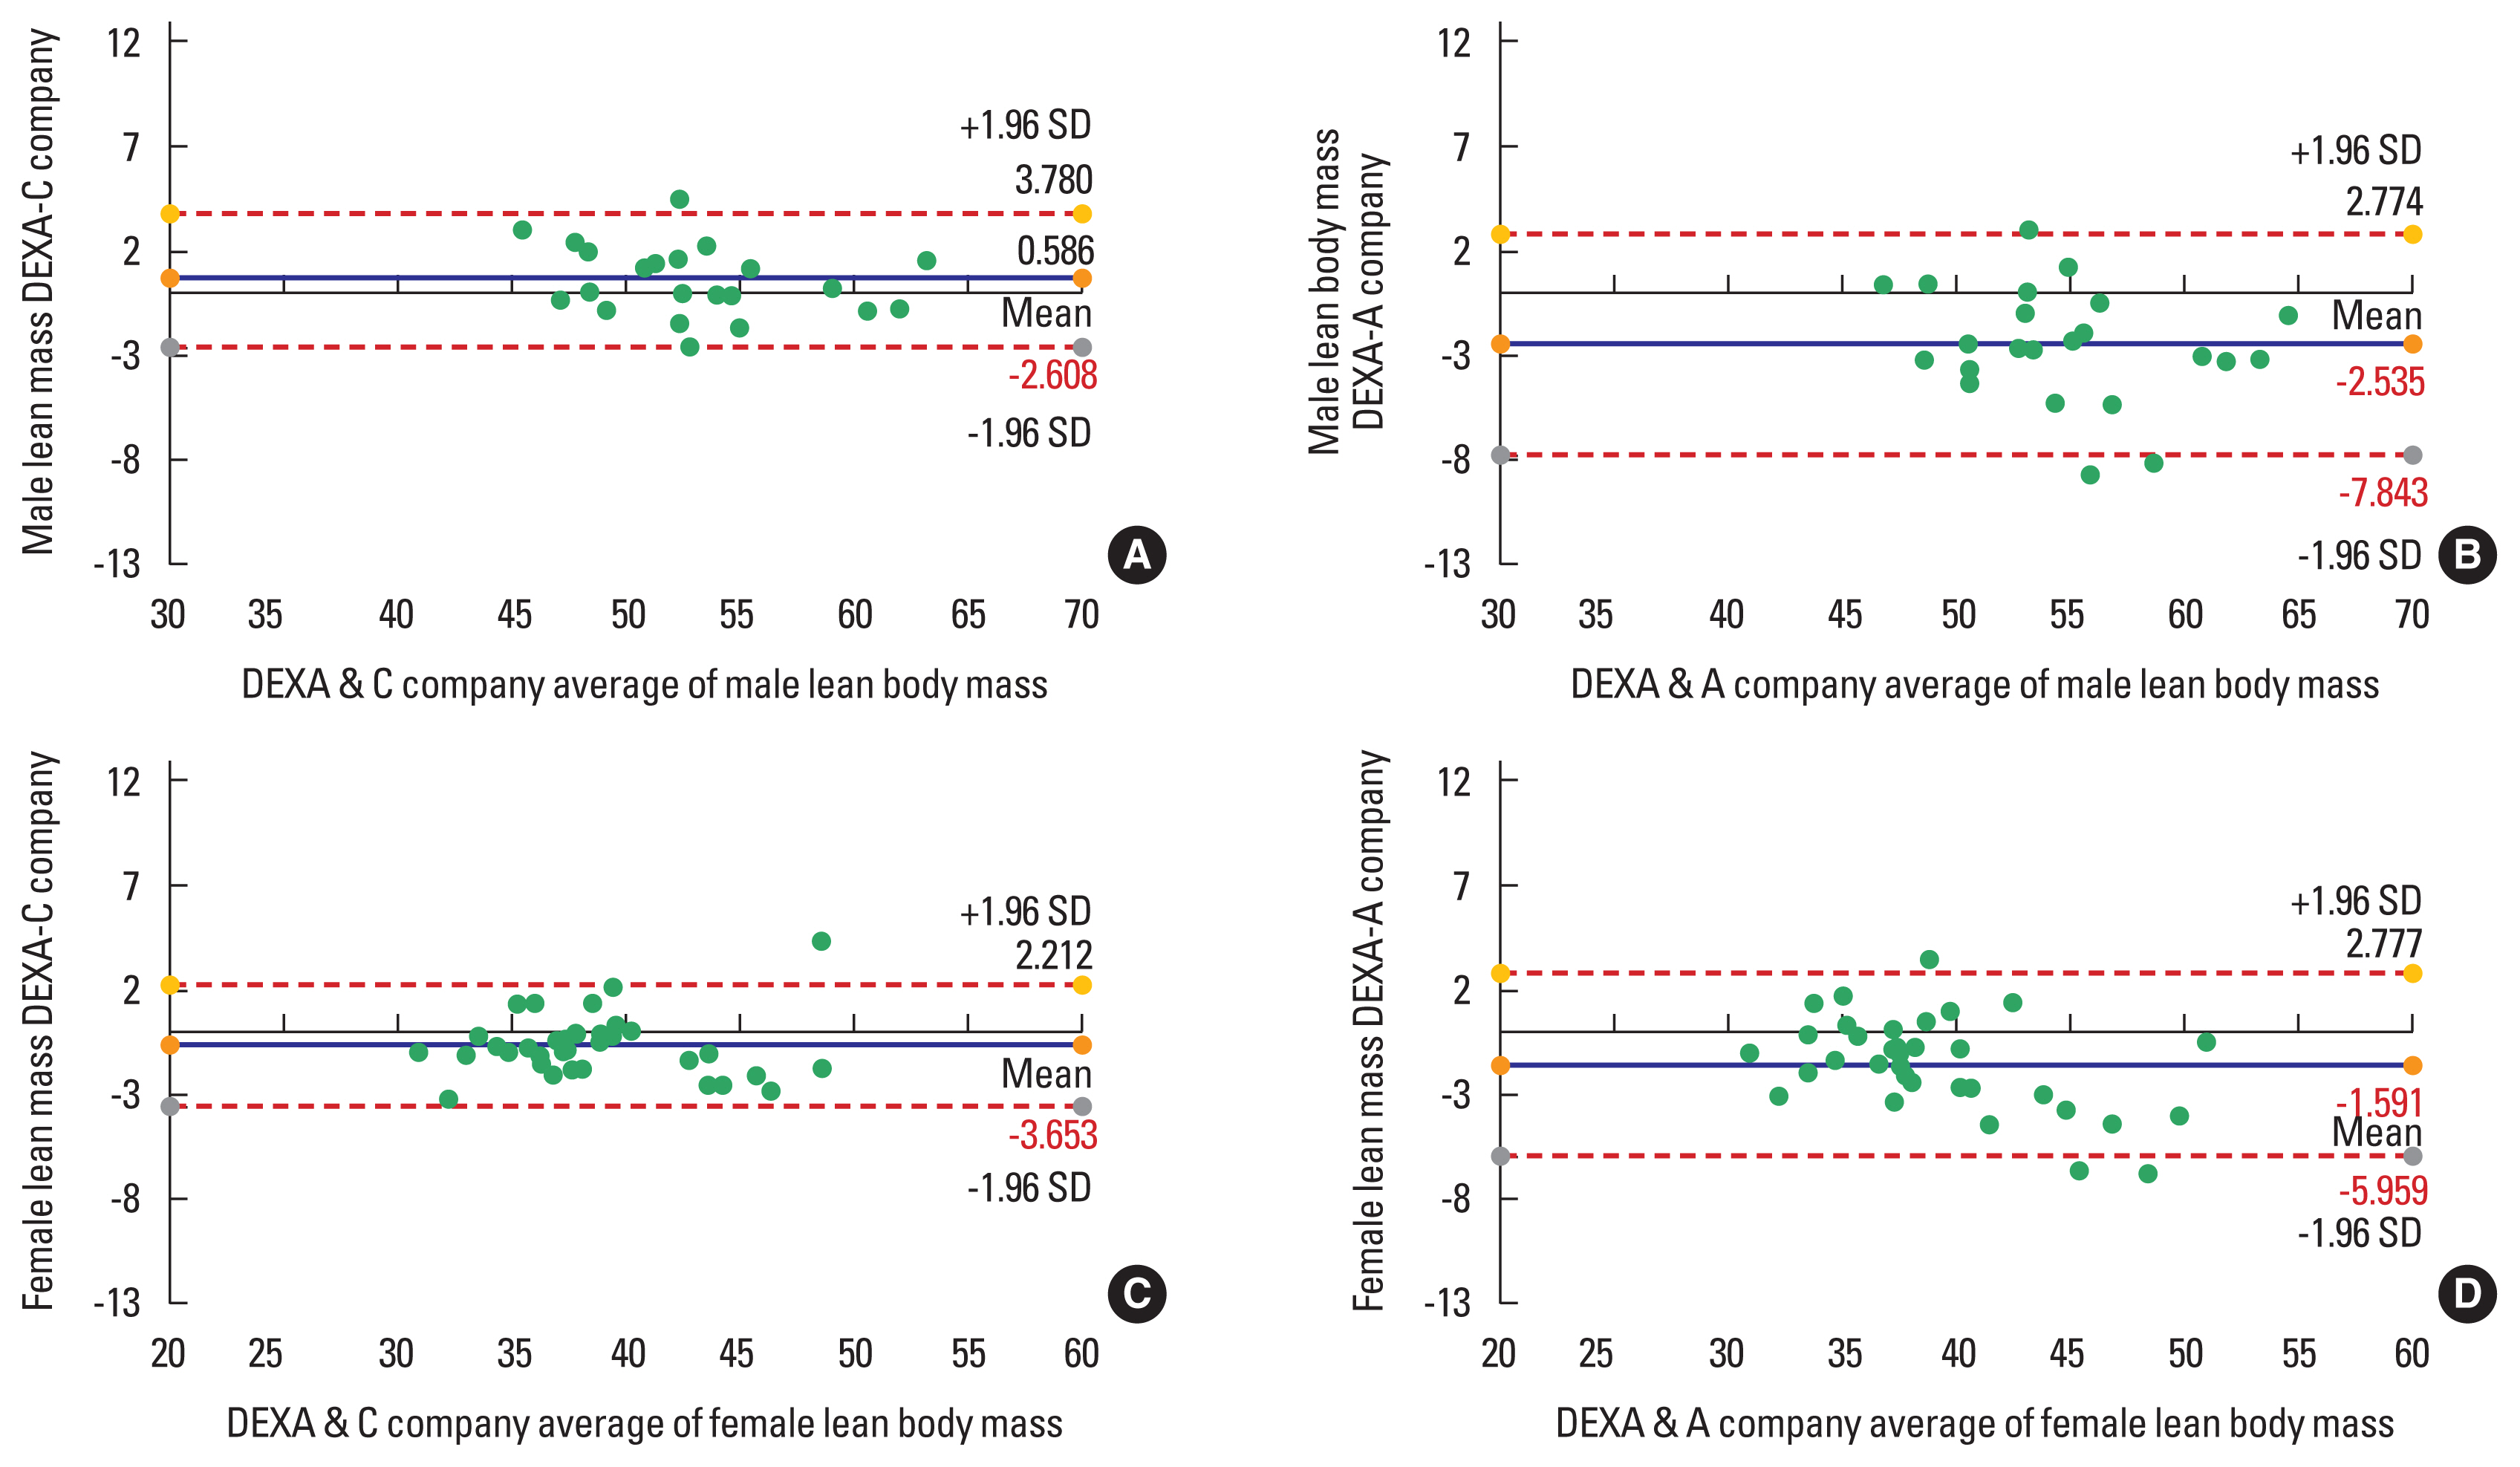
Table 6 is the result of a correlation analysis between the body composition based on DEXA for middle-aged men and the body composition results calculated for each BIA device. In the case of the body fat rate of middle-aged men, the correlation was high in the order of the company B (r=0.920), company D (r=0.838), company C (r=0.881), and company A (r=0.789). Body fat was found to be higher in the order of the company B (r=0.960), company C (r=0.942), company D (r=0.925), and company A (r= 0.876). The correlation of fat-free mass amount was high in the order of the company C (r=0.942), company B (r=0.935), company D (r=0.917), and company A (r=0.846). The company B’s physical composition results showed the highest correlation with DEXA, and the company A’s physical composition results showed a relatively low correlation compared to other BIA equipment. Overall, BIA equipment showed a high correlation with DEXA but a relatively low correlation between body fat and fat-free mass. Table 7 presents the average, standard deviation, confidence interval (difference score average±1.96 standard deviations), and MAPE values between DEXA and each BIA equipment to present the BIA device consistency evaluation of middle-aged men. The company A’s MAPE was the highest at 7.9%, 7.1%, and 2.2%, respectively, in both body fat rate and free fat mass amount, followed by the company B, company D, and company C (Fig. 2).
The validity of body composition by BIA device based on DEXA for middle-aged women
Table 8 is the result of a correlation analysis between the body composition based on DEXA for middle-aged women and the body composition results calculated for each BIA device. In the case of the body fat rate of middle-aged women, the correlation was high in the order of the company C (r=0.921), company B (r=0.911), company D (r=0.887), and company A (r=0.853). Body fat was found to be higher in the order of the company B (r=0.965), company C (r=0.964), company D (r=0.952), and company A (r=0.909). The correlation was high in the order of company B (r=0.948) and company C (r=0.943), company A (r=0.922), and company D (r=0.907) (Table 9). Overall, the physical composition results of the company B and company C showed a high correlation with DEXA. BIA equipment showed a relatively high correlation with DEXA compared to middle-aged men (Fig. 3).
DISCUSSION
Accurate and valid body composition assessments are essential for determining the effects of nutritional status diagnostic assessments, current and future dietary interventions, estimating health weight for the public and athletes, and observing age-related changes (Fosbøl and Zerahn, 2015; Smith and Madden, 2016). This study selected four types of BIA equipment, which are most widely used to diagnose body composition. It evaluated the reliability of the equipment and the validity compared to the criteria. As a result of repeated measurements by the device of four types of BIA equipment in this study, high reliability was shown in all body composition indicators such as body fat rate, body fat amount, fat-free mass amount, and WHR. The WHR ratio obtained through hip and waist circumference measurement and the validity of WHR by BIA device showed a significant correlation between middle-aged men and women. However, the correlation between middle-aged women was relatively lower than that of middle-aged men. The results of the DEXA body composition analysis and the body composition analysis of middle-aged men and women by BIA device showed a high correlation in all categories, such as body fat rate, body fat amount, and fat-free mass amount. The MAPE by BIA device was relatively higher for middle-aged women than for middle-aged men, and the MAPE of body fat rate and body fat amount for both men and women was higher than fat-free mass amount.
Standardization of BIA measurement conditions is essential to obtain accurate and reproducible data. Errors caused by uncontrolled measurement conditions also affect the body composition analysis prediction equation, and various personal and environmental factors affect the results (Kushner et al., 1996). A study comparing the BIA measurement method in 95 healthy adults, including Esco et al. (2019), when measuring standing and lying down, compared to DEXA measurement results after measuring standing, recorded a slightly lower error when measuring the fat-free mass amount. However, the body fat percentage results in the BIA measurement method did not differ significantly depending on posture, showed similar results to DEXA, and reported that DEXA was replaceable. In this study, the experiment was conducted by controlling the variables that affect the error of these measurements in advance.
First commercialized in the mid-1980s, the BIA measurement method has been widely used for evaluating body composition for the past 30 years due to its ease of use and speed, despite the high cost of measuring equipment among various body composition measurement methods. However, controversy over the accuracy and clinical value of measurement still remain. The most frequent or prediction equations do not measure body composition equally. From this point of view, it is emphasized that the magnitude of the error associated with the BIA measurement method is not different from that observed in the so-called reference measurement method. In a study by Elia (2013), no evidence was found that the fat-free mass index calculated by BIA and anthropometry predicted clinical outcomes better than fat-free mass index calculated by simple anthropometry alone. Although statistically significant, focusing on minor differences between measurement methods can reduce reliability, and such differences can represent clinically small but meaningful differences (Ward, 2019). BIA measurements typically measure from the wrist to the opposite ankle and use two or four electrodes. A small current of about 1- to 10-μA flows between two electrodes, and a voltage is measured between two identical or different electrodes (Foster and Lukaski, 1996). The electrical resistance of the body does not appear constant for all body tissues and body fluids (Geddes and Baker, 1967). Because it analyzes the body composition indirectly rather than directly (Ward et al., 2015), the measured resistance value is converted to the value predicted by the general algorithm. The estimation equation of this resistance can change the result, and essentially the partial inaccuracy of the BIA is a prediction with simplification and assumptions based only on the average value of the population.
On the other hand, a study comparing 82 children with DEXA and BIA showed a remarkably high correlation in body fat rate, more deviation in fat mass amount, and relatively low correlation in body fat amount (Tyrrell et al., 2001). In a study comparing the body composition results of BIA and DEXA in 174 healthy adults, there was a small but statistically significant difference between the body fat rate of BIA and the body fat rate of DEXA. The study reported that fat tends to be overestimated in men and underestimated in women (Kim et al., 2011). As such, the characteristics of the body composition state appear according to gender and age, but the reliability of BIA equipment is steadily improved due to the development of technology and the steady mooring of the estimation equation of predicted variables.
According to a study by Ling et al. (2011) and Miller et al. (2016), using multiple frequencies of BIA devices using eight electrodes had a 94% correlation with DEXA when measuring body fat rate. Muscle mass measurement increased to 99%. In this study, it was confirmed that the reliability of devices due to the repeated measurement of BIA’s equipment was high. In both middle-aged men and women, MAPE was relatively higher than the fat mass amount in body fat rate and body fat amount, which was consistent with the contents of previous studies. Although a group study for various age groups is needed, standardized measurement methods are still lacking (Wootton et al., 2014), but the current level of accuracy may not be a problem for general public use. However, as shown in the results of this study, there was a difference in validity among the four types of BIA, and it may appear as a problem in clinical applications such as nutrition and health of cancer patients or high-risk groups who require more detailed and accurate diagnosis. Since raising questions about these clinical parts is beyond the scope of this study, it is considered that a group study in which a more detailed range of ages is divided is needed in future studies.
The purpose of this study was to analyze the reliability and validity of the body composition results by impedance device and use them as primary data for body composition research. To this end, a total of 58 people, 24 middle-aged men and 34 middle-aged women were recruited by age. In addition, reliability was evaluated through three repetitive measurements for each device for four types of BIA measuring equipment used in Korea. The validity of BIA equipment was analyzed using DEXA, which is used as a reference standard for body composition measuring equipment research. All BIA devices showed high reliability, and WHR automatically calculated from BIA was highly reliable. At the same time, validity was found to need to be improved through modification of the estimation equation. In addition, there were differences in the validity of the body composition analysis of four types of BIA in some equipment. However, equally, both middle-aged men and women showed higher error ranges in body fat rate and body fat amount than fat mass amount. And it was found that middle-aged women had a more significant error in body composition analysis than middle-aged men. In subsequent studies, it is believed that efforts will be needed to expand the population further and increase the accuracy of estimation correction by dividing the age in detail. In addition, efforts to analyze more closely the differences between male and female body fat and fat mass amount characteristics are considered necessary.
In subsequent studies, it is believed that efforts will be needed to expand the population further and increase the accuracy of estimation correction by dividing the age in detail. In addition, efforts to analyze more closely the differences between male and female body fat and fat mass amount characteristics are considered necessary.