Effects of aerobic exercise on blood pressure and lipids in overweight hypertensive postmenopausal women
Article information
Abstract
Menopause may increase risk of hypertension and abnormal lipid profile. The aim of the study was to examine the effects of morning and afternoon aerobic exercises on hypertension and lipids in overweight hypertensive postmenopausal women. Forty five women aged from 49 to 60 years were randomly assigned into three groups. Group (A) 15 patients received medicine, (B) 15 patients performed morning aerobic exercises and received medicine, and group (C) 15 patients performed afternoon aerobic exercises and received medicine. Blood pressure measurement and lipid profile tests were performed before and after the study. The results showed that there was a statistical significant difference among all groups in systolic and diastolic blood pressure, favoring group C. Also there was a statistical significant difference among all groups in lipid levels, favoring group C. Therefore, it can be concluded that morning aerobic exercises were more effective in reducing the blood pressure and lipids than afternoon exercises in overweight hypertensive postmenopausal women.
INTRODUCTION
Menopause is defined as permanent termination of the primary functions of the ovaries, release of ova and hormones that causes uterine lining and shedding (Staessen et al., 2001). The average age of menopause is 51 yr (te Velde and Pearson, 2002).
Hypertensive drugs are usually prescribed to control hypertension. Diuretics and β-blockers are usually used in uncomplicated hypertension. Calcium channel blockers and angiotensin-converting enzyme inhibitors are also listed as first-line drugs. Menopause results in vasomotor changes, urogenital atrophy changes, psychological changes, insomnia. Menopause may increase risks of cardiovascular disease, osteoporosis, abnormal lipid profile, and overweight (Al-Safi and Polotsky, 2015; Saha et al. 2013;). Conti et al. (2014) postulated a sharp increase of hypertension and metabolic dysfunctions after menopause.
Hypertension is the most important risk factor that affects women in the early postmenopausal years (Yanes and Reckelhoff, 2011). Blood pressure surges in the early postmenopausal years (Kim et al., 2014). Kim and associates (2014) showed that uncontrolled hypertension (>140/90 mmHg) had increased from 5.06% in the postmenopausal women in their forties to 10.72–12.36% in those women over 50. Kearney et al. (2005) estimated that 130 million western women has uncontrolled hypertension, and that number will increase to approximately 160 million in the next two decades.
Aerobic exercises, aquatic exercises and relaxation are non-pharmacological methods used to control hypertension in overweight hypertensive postmenopausal women (Arca et al., 2014; Saensak et al., 2013; Swift et al., 2012). Petriz et al. (2015) reported that low intensity exercises reduced systolic blood pressure in rats. Moderate-intensity aerobic exercise (40–70% maximal oxygen consumption) is associated with a significant reduction of blood pressure in hypertensive, normotensive, overweight and normal weight participants (Whelton, 2002).
Regular aerobic exercises have also been shown to improve lipid profile abnormalities and endothelial function (Swift et al., 2012; Wagner et al., 2015). Sessa et al. (1994) showed that aerobic exercise stimulates nitric oxide and prostaglandin release. Exercises also reduced free radical–mediated nitric oxide degradation, sympathetic vasoconstrictor tone and blood pressure (Hinderliter, 2002; Niebauer and Cooke, 2006; Salhotra et al., 2009).
Blood pressure surges steadily during the day and dips nocturnally showing a circadian rhythm (García-Ortiz et al., 2014). However, many hypertensive patients exhibit circadian disturbances in their blood pressure rhythm (Masuki et al., 2005). Some authors such as Park et al. (2005) showed a relationship between time of day for exercise and reduction in blood pressure. They found that evening exercises reduced the blood pressure more than morning exercise. The purpose of the study was to determine the effect of diurnal variation of aerobic exercise on hypertension and lipid profile in overweight hypertensive postmenopausal women.
MATERIALS AND METHODS
Design
This was a randomized trial with participants randomly assigned to one of three groups: (1) group A received hypertensive medications (2) group B received hypertensive medications and morning aerobic exercises and (3) group C received hypertensive medications and afternoon aerobic exercises. The tester made group comparisons at the initial visit and three months follow-up. The duration of intervention was 12 weeks per participant, and each participant in group B and C received three sessions per week.
Participants
Forty-five overweight hypertensive postmenopausal women who met the inclusion criteria were recruited from a gynecologic clinic. A physician examined the women to establish their diagnosis. Inclusion criteria included age between 49 and 60 yr, blood pressure range from 140/90 mmHg to <160/100 mmHg and BMI ranged from 25 to 31 kg/cm2.
Reasons for the exclusion criteria included those with cardiopulmonary disease, neurological dysfunction, liver disorders, auto immune diseases, diabetes mellitus, renal disorders and those with surgical menopause. All patients were at least two years post menopause. The study was conducted during the period from September to December 2014. All subjects signed a consent form permitting the use of their data for research purposes, and confidentiality was assured by the use of an anonymous coding system. Participants were asked to refrain from other forms of physical therapy during the study.
Instrumentation
The researcher used a weight and height scale to measure body mass index before start of the study. The tester also used a mercury sphygmomanometer (Model TXJ-10, Japan) to measure systolic blood pressure (SBP) and diastolic blood pressure (DBP) of each woman before and after end of the study. Lipid profile tests were used to measure level of high density lipoproteins (HDL), low density lipoproteins (LDL), triglycerides (TG) and total cholesterol (TC) before and after the study.
Measurement of blood pressure was performed for each participant before starting the study and after its end. Each participant was asked to assume long sitting position, the rubber cuff of the sphygmomanometer was wrapped around the upper arm and a stethoscope was placed over the brachial artery. The rubber cuff was inflated with the air. As the air in the cuff was released, the first sound heard marked the systolic pressure. As the release of air from the cuff persisted, the point where the sound disappeared marked the diastolic pressure. The tester took the average of two blood pressure measurements.
The lipid profile tests included measurements of HDL, LDL, TG, and TC. The test was performed for each patient before starting the study and after its end. The blood analysis required a 12-h fast. A blood sample of three centimeters was obtained by inserting a needle into a vein in the arm.
Electronic treadmill (DX12-DKB) was used to exercise the participants. It included a large display consisting of liquid crystal display feedback screen, time (minutes), distance (kilometers), speed (hertz), calories (kilocalories), pulse (beats/min), and on/off button. Deck type was ultimate hard-wax reversible deck with running area of 60×20 inches. The height of the deck step was 7.5 inches. The device also included the ultimate deck cushioning system, contact heart rate sensors telemetric and heart rate receiver. The motor was of 1.5 horse power. Speed ranged from 0.80 to 18.00 kilometer per hour.
Procedure
Participants who met the inclusion criteria were randomly assigned to one of three groups. Randomization was done by a computer generated random table. Only one independent investigator, blinded to group allocation, conducted the testing procedures at the baseline, and three months follow up. Participants were randomly divided into three groups: Group A participants received antihypertensive medication (angiotensin-converting enzyme inhibitors) once daily for three months. Group B participants performed morning aerobic exercises (9.00–11.00 am) for 30 min three days per week for three months and received antihypertensive medication (angiotensin-converting enzyme inhibitors) once daily for three months. Group C participants performed afternoon aerobic exercises (16.00–18.00 pm) for 30 min, three days per week for three months and received antihypertensive drug (angiotensin-converting enzyme inhibitors) once daily for 3 months.
Exercise program
The aerobic exercises were walking on the treadmill for 30 min including three phases. Warming-up phase which consisted of walking on the treadmill for five minutes, with low intensity (40% of Maximum Heart Rate, MHR), actual phase which consisted of walking on the treadmill for 20 min with moderate intensity (60–75% of MHR) and Cooling phase which consisted of walking on the treadmill for five minutes with low intensity (40% of MHR). MHR was calculated according to the equation (210-age in years). The frequency of exercise was three times per week for three months. During the training session, the therapist stood near the patient to observe and detect signs of stopping the exercise as dexterity. The therapist continuously asked the patient if she felt pain, dizzy or shortens of breath.
The therapist advised all participants to drink a plenty of water before and after the exercise session to avoid excessive loss of body water during the session. Each patient was instructed to wear comfortable clothes and flat light shoes.
Statistical analysis
Data analysis was performed by using SPSS for Windows. One way analysis of variance test was used for multiple group comparisons. Paired t-test was used to compare between pre-test and post-test treatment.
RESULTS
The mean values and standard deviation (SD) of physical characteristics (age, weight, height and body mass index) of all 45 participants in groups A, B, and C are shown in Table 1. There were not statistically significant differences among the three groups as shown in the Table 1.

Mean values of physical characteristics of groups A, B, and C
Measurement of blood pressure
Systolic blood pressure
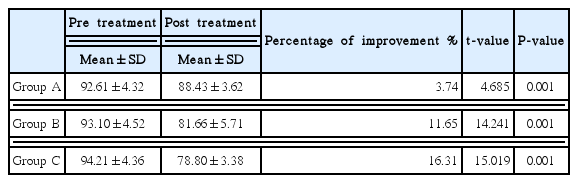
The mean values, SD and percentage of improvement of SBP pre and post treatment for all groups are shown in Table 2. For pretreatment values, there was not statistically significant differences between the mean values of SBP of the three groups (P=0.6). For post-treatment values, there was statistically significant difference between the mean value of SBP of the three groups (P=0.001). Also, the mean value of SBP was significantly decreased in group C when compared to group B (P=0.04).

Mean values of SBP measured pre and post treatment in groups A, B, and C
Diastolic blood pressure
The mean values, SD and percentage of improvement of DBP pre and post treatment for all groups are shown in Table 3. For pre-treatment values, there was not statistically significant difference between the mean values of DBP of all groups. For post treatment, there was a statistically significant difference between the mean value of DBP of all groups (P=0.001). Least significant difference test showed a statistically significant decrease in the mean value of DBP of both groups B and C when compared to group A. Also, the mean value of DBP was significantly decreased in group C when compared to group B (P=0.018).
Mean values of DBP measured pre and post treatment in groups A, B, and C
Lipid profile tests
High density lipoprotein (HDL)
The mean values, SD and percentage of improvement of HDL pre and post-treatment for all groups are shown in Table 4. For pretreatment values, there was not statistical significant difference between the mean value of HDL of all groups (P=0.085). For post-test values, there was statistical significant difference between the mean value of HDL of the three groups (P=0.01), favoring group C. Least significant difference test showed a statistically significant increase in the mean value of HDL of group C when compared to group A (P=0.004). There was statistical significant difference between groups B, and A (P=0.02). On the other hand, there was no statistical significant difference in the mean value of HDL between groups C and B (P=0.5).

Mean values of HDL measured pre and post treatment in groups A, B, and C
Low density lipoprotein (LDL)
The mean values, SD and percentage of improvement of LDL pre and post treatment for all groups are shown in Table 5. For pretreatment values, there was not statistical significant difference between the mean value of LDL of groups A, B and C (P=0.992). The mean value of LDL post treatment was found to be significantly decreased in all groups (P=0.04), favoring group C. Least significant difference test showed a statistical significant decrease in the mean value of LDL of group C when compared to group A (P=0.01). On the other hand, there was not statistical significant difference in the mean value of LDL between groups A and B (P=0.4) and at the same time between groups B and C (P=0.09).
Mean values of LDL measured pre and post treatment in groups A, B, and C
Triglycerides (TG)
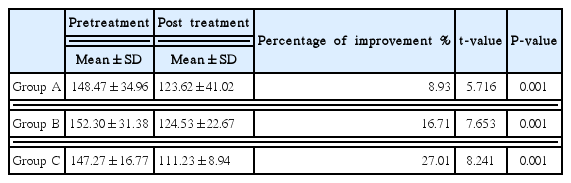
The mean values, SD and percentage of improvement of TG pre and post treatment for all groups are shown in Table 6. For pre-treatment values, there was not statistical significant difference between the mean values of TG of the three groups (P=0.06). For posttest values, there was statistical significant difference between the mean values of TG in the three groups (P=0.01), favoring group B. Least significant difference test showed a statistically significant difference in the mean value of TG of group C when compared to group A (P=0.003). On the other hand, there was not statistical significant difference in the mean value of TG between groups A and B (P=0.1) and at the same time between groups B and C (P=0.1).
Mean values of TG measured pre and post treatment in groups A, B, and C.
Cholesterol
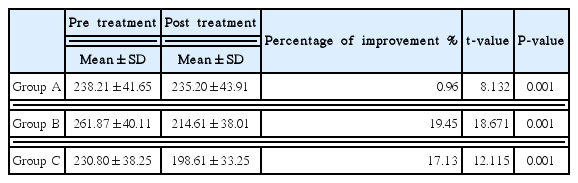
The mean values, SD and percentage of improvement of cholesterol pre and post treatment for all groups are shown in Table 7. For pretreatment values, there was not statistical significant difference between the mean value of cholesterol of all groups (P=0.5). For posttest, the mean value of cholesterol post treatment was found to be significantly decreased in the three groups favoring of group C. There was statistical significant difference between the mean value of cholesterol in all groups (P=0.04). LSD test showed a statistical significant difference in the mean value of cholesterol of group C when compared to groups A (P=0.02) and group B (P=0.04). On the other hand, there was not statistical significant difference in the mean value of cholesterol between groups A and B (P=0.7).

Mean values of cholesterol measured pre & post treatment in groups A, B, and C
DISCUSSION
The results of this study showed a statistical significant difference between the mean values of SBP, DBP, HDL, LDL, TG, and cholesterol in groups A, B, and C. The results of the current study showed that women who exercised in the afternoon showed the most significant statistical difference compared with those who exercised in the morning or received medications. The percentage of improvements was 30.97% in group C compared to 5.99% in group A and 17.29% in group B. The results of this study should be carefully interpreted as results vary by cooperation of patients, individual responses, health status of each patient and variability of patients and their reaction.
The results of the current study are supported with study of Park et al. (2005) who reported that afternoon exercise exhibited a greater reduction in SBP. The results of this study agreed with the study of Jones et al. (2006) that reported that blood pressure is normally reduced after a bout of exercise, but this post-exercise hypotension may be absent or reversed with morning exercises. The results of the current study also agreed with Jones et al. (2008) who confirmed that the acutely hypotensive effects following 30 min of continuous exercises are less substantial in the morning, probably because the exercise-mediated decrease in peripheral resistance is not as apparent at this time of day.
These results are supported by the findings of Havelkov et al. (2007) who found that systolic and diastolic pressures significantly increased in patients who underwent morning exercise training and significantly decreased in those who did their exercises in the afternoon. This shows that the time of exercises influences the average value of blood pressure during the circadian cycle.
The results of this study also agreed with Jones et al. (2009) who concluded that afternoon exercises with interrupted rest periods reduced blood pressure more than continuous exercises. Findings of this study is also similar to those of Tibana et al. (2013) who found decrease of SBP and DBP post resistance exercise in the nighttime in overweight and obese middle-aged women.
Findings of this study agreed with Leon and Sanchez (2001) who reported that moderate or vigorous aerobic exercise improved the blood lipid profile. Results of this study are also similar to those of Roberts (2002) who showed that regular exercises and dietary alterations decreased oxidative stress, increase nitric oxide availability and improved the overall metabolic profile.
These results are supported by Trejo-Gutierrez and Fletcher (2007) who concluded that exercise exerted an effect on HDL-C maturation and composition, cholesterol efflux, and cholesterol delivery to receptors (reverse cholesterol transport). Positive effects of exercise were also seen with blood TG, but little specific effect was seen on LDL-C and total cholesterol. Also, results of this study came in consistency with Ghahramanloo et al. (2009) who reported that aerobic exercises improved the serum lipid profile and body composition of sedentary healthy young men. Results of this study were also supported by the findings of Wagganer et al. (2015) who demonstrated aerobic exercises increased HDL and lowered LDL, TG, and TC in 12 young overweight adults. Therefore, it could be concluded that aerobic exercises done in the afternoon was more effective in lowering the blood pressure and improving lipid profile than that performed in the morning in hypertensive overweight postmenopausal women.
There are a number of potential biases that could threaten the validity or the conclusions and for these reasons future investigation remains necessary in order to better understand the clinical value of the aerobic exercises in the management of hypertension and abnormal lipid profile in hypertensive overweight postmenopausal women. Perhaps the biggest limitation of this study relates to small sample size. Moreover, participants may have received other medications and other forms of physical therapy that may influence the results of this study. More studies are needed about different exercise approaches on preventing or treating other postmenopausal symptoms.
Notes
CONFLICT OF INTEREST
No potential conflict of interest relevant to this article was reported.