Comparison of tests for measuring maximal exercise ability in elite swimmers
Article information
Abstract
The purpose of this study was to compare of tests for measuring maximal exercise ability in elite swimmers. The high-school male elite swimmers (n=17) were performed maximal exercise ability tests. The experimental method consisted of a crossover design at 1-week intervals with the swimming tests (field test, water VAMEVAL test, 200-m test, and 400-m test) in random order. It measured the heart rate, ratings of perceived exertion (RPE), and lactate level by physiological factors, and swimming velocity (SV), stroke rate (SR), and stroke length (SL) by mechanical factors. The change of SV, SR, and SL in swimming tests was no significantly different. To compare tests, however, the lactate level and RPE in 200-m test was higher than water VAMEVAL test. The RPE of the 200-m and 400-m tests were higher than the field test and the water VAMEVAL test. Correlations showed between the field test and the 400-m test in heart rate and RPE. Moreover, a correlation observed between the field test and 200-m test in heart rate. In this study, 200-m and 400-m tests were suit to apply the test methods for establishing the exercise intensity appropriate for the underwater training of swimmers.
INTRODUCTION
To obtain the optimal result in a sports match by increasing the athletic performance of athletes, damages from fatigue and excessive training should be decreased, and the type and amount of training should be planned according to the age and competition level of the athlete and the characteristics of the sports event (Graham, 2002; Matveyev, 1965). However, trainings carried out in the field are often determined by using simple standards such as training hours and training performance set based on the coach’s experience, or the general records set by other athletes (Oussama and Gheorghe, 2014).
The physical fitness evaluation of athletes effected by the sports characteristics and physiological validity (Carminatti et al., 2013). The physical fitness factor that coaches consider most important in the training of swimmers is endurance. Endurance is related to the increase in hypertrophy or tension of the cardiac muscle, thereby resulting in transfer of more nutrients and oxygen to the working muscle (Vasile, 2014). Traditionally, the continuous incremental test was used in the laboratory for measuring the aerobic capacity for endurance, mainly providing results such as maximal aerobic capacity, VO2max, and lactate threshold (Faude et al., 2009).
However, tests in the laboratory are expensive and takes long time to apply in the field training of athletes. Moreover, they present the problem of not being able to readjust the intensity by repeated measurements even when the exercise performance ability of athletes is increasing as the training continues (Carminatti et al., 2013). For this reason, various field tests that largely take into account the sport-specific characteristics mostly suggested. To evaluate the maximal aerobic capacity, many field tests developed and applied; the track running test (Léger and Boucher, 1980), 20-m shuttle run test (Bangsbo et al., 1990), distance intermittent shuttle-run test as progressive maximum test (da Silva et al., 2015) and T-VAMEVAL test as increasing speed in a continuous and incremental way (Cazorla, 1990).
However, these measurements can apply differently according to exercise type. In an underwater environment, the physiological variables can be different owing to increased relative resistance, as the propulsion decreases in this environment because of the relatively smaller repulsive force than on the ground, and the density of water is greater than that of air (Maglischo, 2003). Ryu et al. (2003) reported that the maximal heart rate is about 6.88% lower during underwater maximal exercise than that on the ground. Such a difference occurs because the posture, breathing method, muscle group used, and the blood vessel pressure affecting the heart during exercise are different between the two environments (Lotshaw et al., 2007). Therefore, it could be different to measure the aerobic capacity in underwater compare to the ground environment.
Furthermore, to increase the endurance of swimmers, various underwater training methods such as basic endurance training (En-1), threshold endurance training (En-2), overload repeats (En-3), lactate tolerance training (SP1), and lactate production training (SP2) are applied to all swimmers (including sprint swimmers and long-distance swimmers) (Vasile, 2014). The physiological ability tests implemented by most sports scientists are laboratory methods performed through an incremental protocol (Ryu et al., 2003; Gore, 2000). However, research on a field barometer that evaluates athletic performance in swimmers is lacking little, and thus most coaches create exercise programs based on physical fitness tests carried out in the field. Therefore, it may be inappropriate to apply the implement underwater training intensity and training amount based on the aerobic capacity by a laboratory method or a track-running test for swimmer who mainly attend in underwater training. The VAMEVAL test is a method for evaluating aerobic capacity as the speed increases incrementally during running (Cazorla, 1990), and it is suggested to be useful for measuring aerobic capacity according to speed changes during underwater training (Honceriu et al., 2014). In the case of underwater events, the measurement usually uses ground values apart from game records, although the actual exercise is carried out underwater. Comparison of the test data between ground training and underwater training can be used to improve speed and efficiency, and is expected to increase the efficiency of the training process.
Among preceding studies on the VAMEVAL test in swimmers, Oussama and Gheorghe (2014) and Sabri and Gheorghe (2014) reported that the maximal aerobic speed (VAM or VAMEVAL, which can be measured underwater) and the 2,000-m swimming test in maximum speed were used as standards to establish training intensity and load for national team swimmers. However, such underwater test methods are not being actively applied on the field, as these results are not consistent in previous studies as follows;
Oussama and Gheorghe (2014) showed that there is no relation between the VAMEVAL test and the 2,000-m test. Ryu et al. (2003) showed that there is a difference in speed due to maximal capacity attained between 4 and 9 min in the VAMEVAL test, whereas more time is needed in the 1,400-m test. Lavoie and Montpetit (1986) reported that the 400-m test, which ends within 6 min, has a higher relation with the VAMEVAL test. Sabri and Gheorghe (2014) reported that only the 100-m and 200-m tests showed a relation when the 100-, 200-, 400-, 800-, and 1,500-m tests and the VAMEVAL test were compared.
Therefore, it seems that test methods that can be conducted in an underwater environment would be more appropriate for swimmers than the maximal aerobic capacity tests used on the ground, to plan and carry out training that can increase the maximal performance ability. However, further research is necessary because the study reports on underwater test methods lack consistency.
Therefore, this study was to suggest the necessity of an underwater test, and to provide basic data that can be helpful in planning and conducting training for swimmers. To compare the water VAMEVAL test and underwater test (200- and 400-m tests) which suited to sprint and long-distance events, so that tests can be analyzed the relations between the VAMEVAL test carried out on the field and the physiological factors of underwater tests.
MATERIALS AND METHODS
Subjects
The participants in this study were recruited from high-school male elite swimmers who had at least 3 yr of swim training experience. The purpose and the procedures of this experiment were explained to all participants, and a medical interview was conducted to verify their health and medication status before obtaining their consent for participation. The physical characteristics of the participants are shown in Table 1.

Physical characteristics of subjects (n=17)
Methods
The experiment was performed in a swimming pool (indoor temperature, 25°C±1°C; water temperature, 271°C). Twenty-four hours before the experiment, the participants were restricted from excessive exercise, caffeine intake, smoking, and alcohol consumption, and asked to obtain sufficient sleep. The experimental method consisted of a crossover design at 1-week intervals with the swimming tests (field test, water VAMEVAL test, 200-m test, and 400-m test) in random order. Video recordings were used to analyze the swimming speed, number of strokes, and stroke length by using a video analysis software (team pro 5.5, Dartfish, Fribourg, Switzerland).
The swimming tests
Field VAMEVAL test
A progressive test was used to evaluate elite swimmers. The speed was increased by 0.5 km/hr every minute, with the initial speed set at 8 km/hr. The total duration of the test could be between 12 and 15 min. The training would be stop when the imposed speed or the next stage in training could no longer be achieved (Cazorla, 1990).
VAMEVAL test
A progressive swimming test at 1-min increments was carried out to determine the maximum speed and reach the maximum oxygen consumption (Carminatti et al., 2013). The speed was increased by 0.05 m/sec every minute, with the initial speed set at 1.00 m/sec. The total duration of the test was between 12 and 15 min. The training would be stop when the swimmer could no longer attain the imposed speed and when the delay reached 1 m (Orwoll et al., 1989; Oussama and Gheorghe, 2014; Sabri and Gheorghe, 2014).
The 200- and 400-m tests
The 200- and 400-m tests were performed with maximal speed. The procedure of Oussama and Gheorghe (2014) with the tests starting in water applied.
Physiological method
Heart rate was measured immediately after the cessation of each swimming test, through main artery palpation. The sampling frequency was set at 15 sec.
A blood sample (25 μL) was taken from a fingertip before the first swim and again immediately after each swim test period. The lactate levels analyzed immediately (Lactate Pro, Tokyo, Japan) after each periods.
The ratings of perceived exertion (RPE) were measured by using Borg’s scale (score of 6–20).
Mechanical method
For the evaluation of various parameters in this study, swimming velocity (SV), stroke rate (SR), and stroke length (SL) measured using the methods of Costill et al. (1985) at each tests. The parameters were assessed as follows;
SV (m/sec)=SR×SL
SR (stroke/min)=(60×3)/time per three strokes (sec)
SL (m/stroke)=(SV [m/sec]×60)/SR (stroke/min)
Statistical analysis
Data were analyzed by using the IBM SPSS ver. 18.0 (IBM Co., Armonk, NY, USA). Descriptive statistics were used to determine the general characteristics of the variables. One-way analysis of variance with Tukey post hoc tests was used to determine significant differences in physiological and mechanical characteristics in swimming tests (water VAMEVAL, 200-, and 400-m). The magnitude of effects was qualitatively assessed according to Hopkins et al. (2001) as follows: trivial r<0.01, small 0.1<r<0.3, moderate 0.3<r<0.5, high 0.5<r<0.7, very high 0.7<r<0.9, nearly perfect r>0.9, and perfect r=1.0 Statistical significance was set at P<0.05.
RESULTS
The change of physiological factors in swimming tests
The change of heart rate in swimming tests
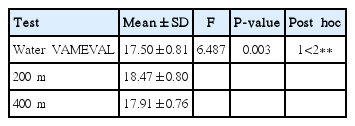
Table 2 shows the change of heart rate in the swimming tests. The difference among the three tests was not statistically significant.

The change of heart rate in swimming tests
The change of lactate level in swimming tests
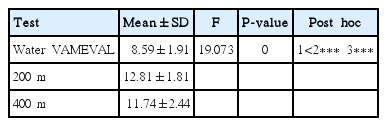
Table 3 shows the change of lactate level in the swimming tests. There were significant differences between groups (P<0.001), with the 200-m test (P<0.001) and 400-m test (P<0.001) showing higher than the water VAMEVAL test.
The change of lactate level in swimming tests
The change of mechanical factors in swimming tests
The change of speed in swimming tests
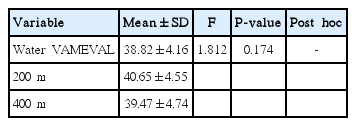
Table 5 shows the change of speed in the swimming tests. The difference among the three tests was not statistically significant. No significant differences were found among the tests.

The change of speed in swimming tests
The change of stroke in swimming tests
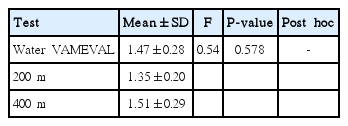
Table 6 shows the change of stroke in the swimming tests. The difference among the three tests was not statistically significant. No significant differences were found among the tests.
The change of stroke in swimming tests
The relationship between the field test and the water VAMEVAL test
The physiological change in the field test and the water VAMEVAL test
Table 8 shows the physiological change in the field test and the water VAMEVAL test. The heart rate was higher in the field test than in the water VAMEVAL test (P<0.05). The RPE of 200 m was higher than water VAMEVAL test (P<0.01). The lactate level of the 200- and 400-m tests were higher than those of the field test and the water VAMEVAL test (P<0.001).

The physiological change in field test and water VAMEVAL test
The relationship of physiological factors in the field test and the water VAMEVAL test
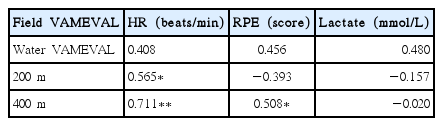
Table 9 shows the physiological change in the field test and the water VAMEVAL test. Correlations were seen between the field test and the 400-m test in heart rate (P<0.01) and RPE (P<0.05). Moreover, a correlation was observed between the field test and 200-m test in heart rate (P<0.05).
The relationship of physiological factors in field test and water VAMEVAL test
DISCUSSION
To compare of three types of maximal exercise ability tests in an underwater environment and field tests, this study suggest to suggest for water test and to establish the appropriate intensity for underwater training of swimmers for planning training programs to increase athletic performance. The results of this study showed that the physiological indicators obtained in underwater maximal exercise ability tests revealed significant differences among tests in lactate concentration, and the field and underwater tests showed significant differences in heart rate and lactate concentration.
Generally, elite swimmers perform both ground training and underwater training in order to enhance their athletic performance (Wakayoshi et al., 1995), and the training consists of methods to improve physical fitness factors such as endurance, speed, muscular endurance, maximum muscular strength, and power. Although various factors affect the swimming performance ability during a match, the physical fitness factor that coaches consider most important in training is endurance. As endurance increases the hypertrophy or tension of cardiac muscle, thereby transferring more nutrients and oxygen to the working muscle (Vasile, 2014), endurance plays an important role in the athletic performance of swimmers. In underwater training, various basic endurance training methods are being applied to all swimmers regardless of the type of swimming program step (sprint or long distance), such as En-1, En-2, En-3, SP1, and SP2 (Vasile, 2014). In these swimming training methods, the heart rate and lactate concentration level is suggested in each program step for reaching the target heart rate and for prevention of muscle fatigue, and exercise intensity is controlled through the swimming speed and distance (Maglischo, 2003). To set of swimming training intensity, heart rate used as the measurement parameter instead of cardiorespiratory system caused by measurement difficulty. To measure the maximal exercise ability of swimmers for the setting of training intensity, field test such as treadmill test (Ryu et al., 2003), Wingate test (Hawley et al., 1992), isokinetic test (Miyashita and Kanehisa, 1979), and basic physical fitness test (Lee et al., 2004) used and suggested as standards.
Exercise tests based on laboratory protocols can provide various physiological and mechanical information (Juliano et al., 2011); however, they have the limitation of providing information tailored to the characteristics of each exercise, and tests that can evaluate physiological responses tailored to both exercise characteristics and the type of training field are important as well (Honceriu et al., 2014). In particular, as swimming is carried out in water in a lying face-down or a lying face-up position. As the pressure increases in water, the venous return increases, increasing the pressure in the cardiovascular system, which, in turn, decreases the heart rate (Lotshaw et al., 2007). Therefore, if the test results of maximal exercise ability measured on the ground are used to decide the exercise intensity of a swimming training program, this induce muscle fatigue and injury in swimmers owing to inappropriate exercise load and excessive training (Kang et al., 2012).
VAMEVAL is a method for measuring the aerobic/anaerobic capacity of athletes by increasing the training intensity level continuously every minute until reaching the maximum speed. Carminatti et al. (2013) suggested the use of the VAMEVAL measurement method for measuring maximal exercise ability even underwater. Furthermore, there have been reports on various swimming test methods and their measurement effectivity (Cazorla, 1990; Lavoie and Montpetit, 1986). Oussama and Gheorghe (2014) reported that the underwater VAMEVAL test did not show a relation with the 2,000-m test, and stated that this result was due to the negative impact on physical ability and energy metabolism due to increasing swimming time.
Heart rate is one of the representative physiological indicators by which energy metabolic capability can be determined, exercise performance ability can be evaluated, and exercise intensity can be prescribed (Keskinen et al., 2007). In this study, the maximal heart rate in the field VAMEVAL test was 192±11 beats/min. In the study by Carminatti et al. (2013), the maximal heart rate in the field VAMEVAL test was 194±14 beats/min, showing a similar result to the preceding study. However, the maximal heart rate in the underwater VAMEVAL test was 179.25±17.72 beats/min, that in the 200-m test was 182.63±11.81 beats/min, and that in the 400-m test was 183.18±11.25 beats/min, which were lower than that in the field VAMEVAL test. In particular, in the case of the field VAMEVAL test, the maximal heart rate was significantly higher than that of the underwater VAMEVAL test (P<0.05). The difference of maximal heart rate between the field and underwater VAMEVAL tests can be ascribed to the aforementioned fact that heart rate decreases in an underwater environment owing to the increased load of the cardiovascular system due to underwater pressure, rather than because of the difference in exercise intensity (Lotshaw et al., 2007). Therefore, as training intensity can be relatively increased when the results of maximal exercise ability test measured on the ground are applied to underwater training, this study suggests that the exercise intensity for underwater training programs is more appropriately set through an underwater maximal exercise ability test.
Lactate is produced through the anaerobic metabolism of muscle according to the type and intensity of exercise (Mathew et al., 1971). Blood lactate is used as an important indicator of predicting anaerobic metabolism of muscle exercise based on the energy metabolism process (Sahlin, 1986), and for evaluating the level of fatigue after exercise (Jacobs et al., 1985). In this study, the levels of lactate were 8.59, 12.81, and 11.74 mmol/L, in underwater VAMEVAL, 200-m, and 400-m tests, respectively, being higher in the case of the 200-m and 400-m tests than that in the underwater VAMEVAL test. The 200-m and 400-m swimming test also showed higher lactate concentrations than the field VAMEVAL test. Furthermore, RPE was higher in the 200-m test than in the underwater VAMEVAL test. The higher blood lactate level and RPE in the 200-m test may be explained by the fact that in the 200-m test, maximal exercise ability has to be produced in the shortest span of time. In reality, when participating in the 400-m test, swimmers swim in a rather slow pace in the first 200 m, and increase their speed in the last 200 m; therefore, no differences in all physiological indicators or swimming techniques were observed compared with the 200-m test. Moreover, the underwater VAMEVAL test takes about 12–15 min, which is longer than the durations of the 200-m or 400-m test, and the swimming speed increases gradually (Ryu et al., 2003). Therefore, although it was not revealed in the results, in the last maximum speed section, the swimming speed and distance were decreased slightly, and it is expected that this resulted in lower heart rate, lactate concentration, and RPE measured after water VAMEVAL test compared with the other underwater tests.
Concerning heart rate, a relation between the field test and the underwater test was found, r=0.565 (P<0.05) in 200 m and r=0.711 (P<0.01) in 400 m. The 400-m test tended to high correlation, whereas the underwater VAMEVAL test did not show a significant correlation. However, lactate did not reveal a significant correlation between the field test and the underwater test. Moreover, in the case of RPE, only the 400-m test showed a significant correlation with the field test (r=0.508), and the values of maximal exercise in the field test and underwater test generally showed a low correlation apart from the heart rate.
Therefore, when planning and programming swimming training, this study suggests that it would be more appropriate to establish the exercise intensity through maximal exercise ability tests conducted underwater. In particular, the 200-m or 400-m test seems to be more effective on the field as it can make athletes achieve their maximum capacity in a shorter periods of time compared with underwater VAMEVAL, which takes longer time and needs a specific space. Furthermore, we suggest that it would be helpful to select and use the test according to the exercise type (sprint or middle-/long-distance swimming).
In conclusion, underwater exercise tests and field tests were conducted to identify the test methods for establishing the exercise intensity appropriate for the underwater training of swimmers. The field test resulted in higher heart rates than did the underwater test, and therefore it was revealed that exercise intensity should be increased in underwater training if the exercise intensity is used in underwater training. Furthermore, among the underwater tests, lactate concentration and RPE showed higher levels in the 200-m and 400-m tests than in the underwater VAMEVAL test, and there was a difference in the measurement values of maximal exercise ability. Therefore, the 200-m or 400-m test, which are suited to the exercise characteristics of sprint or long-distance swimming, are expected to be more effective on the field than the VAMEVAL test, which takes a long time and has difficult measurement methods, or the field test, which shows differences in physiological variables in underwater maximal exercise.
Notes
CONFLICT OF INTEREST
No potential conflict of interest relevant to this article was reported.