Upper-body Wingate test classificatory table for adult judo athletes
Article information
Abstract
The aims of this study were to compare the upper-body Wingate test performance of judo athletes from different weight categories and to create a classificatory table for this test. A total of 179 judo athletes performed an upper-body Wingate test, following standardized recommendations (30-sec duration, and a load equivalent to 0.06 kg/kg of body mass). Absolute and relative peak power (PP) and mean power (MP) were determined. Weight categories were compared through a one-way analysis of variance, followed by Tukey test. The effect size was determined by partial eta squared. There was a large effect of weight category in absolute PP and MP, with lower values for the lighter categories (P<0.05), but it is important to note that absolute PP and MP did not differ (P>0.05) between subsequent weight categories. Moreover, when the relative PP and MP were considered, no significant differences were found (P>0.05). The higher values of PP and MP achieved by heavier judo athletes compared to lighter ones during the upper-body Wingate test is likely related to the higher total muscle mass presented by the first group compared to the later. Indeed, judo athletes from different weight category presented similar relative PP and MP, likely due to the judo training demands as well as consequence of a selection of athletes with the higher potential to develop upper-body anaerobic fitness. Finally, the normative classificatory table created may be useful as a reference in judo athletes’ anaerobic evaluation.
INTRODUCTION
Judo is a high-intensity grappling combat sport, in which athletes need to develop excellent technical and tactical skills (Franchini et al., 2008), supported by physical (Franchini et al., 2011; Franchini et al., 2013) and psychological preparation (Ziv and Lidor, 2013) to be successful in high-level competition. Although several physical capacities can contribute to judo competitive performance, anaerobic power and capacity are considered key components (Franchini et al., 2011). As throwing techniques involve lower- and upper-body muscle power, the phosphagens system (ATP-PCr) is considered the most relevant energy pathway contributing to such actions (Julio et al., 2017). However, as the judo combat is based on long periods of grip dispute, comprising more than 50% of the valid time (Marcon et al., 2010), upper-body strength-endurance and anaerobic capacity are important to perform this skill (Franchini et al., 2013). Moreover, as the throwing technique attempts are repeated many times during the match (Marcon et al., 2010), a glycolytic contribution may be relevant to sustain these efforts (Julio et al., 2017).
The use of physiological testing is considered essential to evaluate judo athletes’ physical fitness and to provide setting guidelines for individualized training programmes (Kim et al., 2011). Although the most valid measurement of anaerobic capacity is the maximal accumulated oxygen deficit, its measurement involves several testing sessions, which makes the process extremely difficult to be conducted in high-level athletes (Scott et al., 1991). Alternatively, the Wingate test and its variables (i.e., peak power [PP] and mean power [MP]) are considered indirect markers of anaerobic power and capacity (Bar-Or, 1987). Specifically, in judo athletes the Wingate test is the most general test used to assess anaerobic fitness (Franchini et al., 2011), and the upper-body Wingate test PP and MP were reported to properly discriminate elite and nonelite judo athletes when body mass was used as a covariate (Franchini et al., 2005b). As judo athletes present a high upper-body solicitation during the judo match (Franchini et al., 2013), it is common that they spend a large amount of time to develop the anaerobic fitness of muscle groups from these areas using both specific and general exercises (Franchini and Takito, 2014; Franchini et al., 2014a). In fact, a review demonstrated that the judo athletes’ upper-body Wingate test performance was above the 90th percentile for lower-body measurements in non-athletes (Franchini et al., 2011). Additionally, as judo athletes are classified in seven weight categories, values relative to athletes’ body mass are more relevant during their evaluation process. However, no studies were found comparing judo athletes from different weight categories concerning their PP and MP. Nonetheless, the observation of data from different studies indicate that heavier judo athletes presented higher absolute PP Wingate test performances compared to lighter judo athletes. Conversely, when values relative to body mass were considered an opposite behaviour was observed (Franchini et al., 2011). The higher body fat percentage commonly observed in heavier judo athletes is an explanation for this result, as a negative correlation was found between total work during two Wingate tests and body fat percentage in high-level judo athletes (Franchini et al., 2005a). Indeed, the fat-free mass of athletes from the South Korea National Judo Team and from the university varsity team was positively correlated with MP (r=0.77 and r=0.63, respectively) and PP (r=0.87 and r=0.48, respectively) (Kim et al., 2011).
However, no study compared the upper-body Wingate test performance of judo athletes from different weight categories and no classificatory table specifically developed for judo athletes performing this test was found. Indeed, as judo athletes from different weight categories frequently train together, the knowledge of upper-body Wingate test performance can be relevant to group them accordingly to relevant physical abilities for this sport (i.e., anaerobic power and capacity). Additionally, the classificatory table can provide coaches, strength and conditioning professionals and physiotherapists with an objective classification of their athletes, affording valuable information for training program and recovery process monitoring. Therefore, the aims of the present study were to compare PP and MP of adult male judo athletes from different weight categories and to develop a classificatory table for these variables. The main hypothesis of the present study was that absolute PP and MP would be higher in heavier athletes compared to lighter ones, whereas the relative PP and MP would present the inverse behaviour.
MATERIALS AND METHODS
Design
This was a cross-sectional, descriptive and comparative study conducted with adult male judo athletes who performed the upper-body Wingate test. A large sample of judo athletes from different weight categories was evaluated during their competitive period, after 24 hr rest and before the beginning of any weight loss procedure.
Sample
One-hundred and seventy-nine male adult judo athletes (age, 22±5 years old; body mass, 78.3±15.7 kg; height, 175.6±7.8 cm; judo practice experience, 13±6 years) were evaluated. Athletes were included if they presented the following characteristics: (a) age between 18 and 35 years-old; (b) competing in the month of the measurement was taken; (c) more than 6 months of uninterrupted judo training; (d) free of injuries that could affect their performance in the upper-body Wingate test. Competitive level varied from regional to Olympic, and athletes from all weight categories were measured. All athletes gave their informed consent to take part in the evaluation process. All procedures were approved by the Brazilian-located University Research Ethics Committee (approval number: 2009/48).
Test and measurements
Age, time of judo practice, body mass, and height
Age and time of practice were assessed subtracting the date of the test by date of birth and date that the athlete started judo practice, respectively. Body mass was measured in a calibrated scale (Filizola, Sao Paulo, Brazil), with 0.1 kg precision and height was measured using a portable stadiometer (Seca 222, New York, NY, USA), with 1-mm precision, in accordance with Heyward (1997).
Upper-body Wingate test
Judo athletes completed one 30-sec upper-body Wingate test. The load was set at 0.06 kg/kg of body mass, based on previous recommendations (Franchini et al., 2003). Before the test a standard warm-up was executed by the athletes: 5 bouts of 30 sec (20 sec at 70 rpm, and 10 sec at 100 rpm) at 50 W. They started each Wingate test after a 3-min interval, and from zero velocity. An EB 4100 upper-body cycle-ergometer (Cefise, Nova Odessa, Brazil) was used to execute the test. Power output was measured every second and the highest value was considered the PP, whereas the average in the 30-sec period was defined as MP. PP and MP were expressed in absolute values (W) and relative to body mass (W/kg) as previously reported (Franchini et al., 2003).
Statistics
Data were analyzed using Statistica for Windows (StatSoft, version 8, Tulsa, OK, USA) The homogeneity of variances and the normality of the sample were confirmed using Levene’s test and the Kolmogorov–Smirnov test, respectively. After confirming these assumptions for the parametric statistics, data were described using mean and standard deviation, and 95% confidence intervals. Weight categories were compared using a one-way analysis of variance, followed by the Tukey test for unequal samples whenever a difference was found in the analysis of variance. Partial eta squared (ηp2) was calculated to determine the effect size, using the 0.0099, 0.0588, and 0.1379 considered as small, medium, and large effect sizes (Richardson, 2011). To develop a classificatory table for each variable, percentile values were adopted to establish the following categories, as used in previous publications with judo athletes (Agostinho et al., 2018; Franchini et al., 2018; Sterkowicz-Przybycień and Fukuda, 2014): excellent, highest 5%; good, next 15%; regular, middle 60%; poor, next lowest 15%; very poor, lowest 5%.
RESULTS
Table 1 presents the absolute and relative PP and MP for male adult judo athletes from different weight categories. There was an effect of weight category for absolute PP (F[6, 172]=19.61, P< 0.001, ηp2=0.406, large), with lower values for the 60-kg weight category compared to 73 kg up to over 100 kg (P<0.001 for all comparisons); lower values for the 66 kg compared to the 73 kg (P=0.007) and to the 81 kg up to over 100-kg weight categories (P<0.001 for these four comparisons); lower values for the 73 kg compared to 90 kg (P<0.001), 100 kg (P=0.008), and over 100-kg weight categories (P<0.001); and lower values for the 81 kg compared to the over 100-kg weight category (P=0.029). There was also an effect of weight category for the absolute MP (F[6, 172]=23.67, P<0.001, ηp2=0.452, large), with lower values for the 60-kg weight category compared to 66 kg (P=0.003), and 73 kg up to 100 kg weight categories (P<0.001 for these four comparisons); lower values for the 66 kg compared to 81 kg (P=0.002), and 90 kg up to over 100-kg weight categories (P< 0.001 for these three comparisons); lower values for the 73 kg compared to the 90 kg up to over 100-kg weight categories (P< 0.001 for all comparisons); and lower values for the 81-kg weight category compared to the over 100 kg (P=0.031). There were no differences between weight categories for relative PP (F[6, 172]= 0.46, P=0.841, ηp2=0.016, small) and MP (F[6, 172]=1.36, P= 0.235, ηp2=0.045, small).
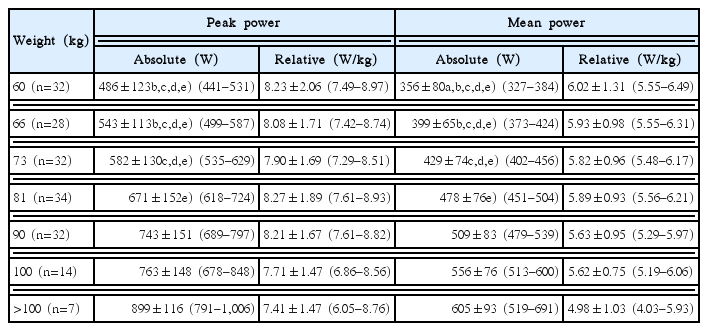
Absolute and relative peak and mean power in adult judo athletes from different weight categories (n=179)
Table 2 presents the absolute and relative PP and MP upper-body Wingate test classificatory table for adult male judo athletes.
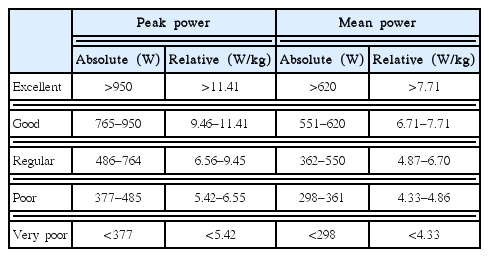
Absolute and relative peak and mean power classificatory table in adult judo athletes (n=179)
DISCUSSION
The results of the present study partially confirmed our initial hypothesis, as absolute PP and MP achieved by heavier judo athletes were higher than those achieved by lighter ones, but no significant differences were found for relative PP and MP. Additionally, a classificatory table was created for upper-body Wingate test absolute and relative PP and MP.
The higher values of PP and MP achieved by heavier judo athletes compared to lighter ones during the upper-body Wingate test is likely related to the higher total muscle mass presented by the first group compared to the later. Indeed, using lower-body Wingate test, Kim et al. (2011) reported a significant and positive relationship between fat-free mass and PP (r=0.77 and r=0.63) and MP (r=0.87 and r=0.48), as well as between muscle mass and PP (r=0.64 and r=0.63) and MP in Korean Judo Team athletes and university varsity Korean athletes (r=0.74 and r=0.48). Moreover, fat mass was reported to be significant and negatively correlated with PP (r=−0.59) and MP (r=−0.61) during lower-body Wingate test in Turkish Olympic judo athletes (Ceylan et al., 2018), and body fat percentage negatively correlated (r=−0.87) with total work in two upper-body Wingate tests in judo athletes from the Brazilian University Team (Franchini et al., 2005a). Despite the higher body fat percentage observed in heavier judo athletes compared to lighter ones, athletes from heavier categories also present higher free-fat mass and muscle mass (Franchini et al., 2011), factors that contribute to their higher PP and MP during the Wingate test (Kim et al., 2011). It is also important to note that absolute PP and MP did not differ between subsequent weight categories, which may be related to the anthropometrical similarity reported in judo athletes from successive weight categories, specifically concerning skinfold thickness and circumferences (Franchini et al., 2014b). Thus, the traditional practice of grouping judo athletes from similar weight categories to perform randori (match simulation) seems to be supported by the judo athletes’ upper-body anaerobic fitness observed in the present study.
However, contrary to a previous observation (Franchini et al., 2011), based on different studies, our findings did not indicate any significant difference between weight categories concerning relative PP and MP achieved during the upper-body Wingate test. Thus, our results suggest that judo athletes from different weight category develop similar relative PP and MP, likely due to the judo training demands (Franchini et al., 2014a) as well as because of a selection of athletes with higher potential to develop upper-body anaerobic fitness (Franchini et al., 2011; Thomas et al., 1989).
Considering that upper-body Wingate test performance has been reported to properly discriminate judo athletes from different competitive levels (Franchini et al., 2005b), some studies used this test version to evaluate male judo athletes (Franchini et al., 2005a; Franchini et al., 2005b; Mickiewitz et al., 1991; Sharp and Koutedakis, 1987; Thomas et al., 1989). When the results of these studies are classified according to the table developed in the present study, the classification follows approximately the competitive level of these groups. Specifically, only athletes from senior British (Sharp and Koutedakis, 1987) and Canadian (Thomas et al., 1989), and junior Polish judo teams (Mickiewitz et al., 1991) being classified as excellent for absolute and relative MP and good for absolute and relative PP. Thus, this table indirectly demonstrated sensitivity to classify judo athletes from different competitive levels.
In conclusion, our study provided normative data using a large sample size (n=179), and the results of upper-body Wingate test performance of judo athletes can now be evaluated using a five-grade scale. These values can be used as a reference to guide judo athletes’ anaerobic training and can be relevant for goal setting concerning anaerobic fitness either peaking for a specific competition or during different phases of the rehabilitation process. The response to different periodization training programs can also be monitored using this table as a reference, as proposed for other tests (Agostinho et al., 2018; Franchini et al., 2018). Future studies should focus on table development for female judo athletes and to athletes from different age categories. As athletes from successive weight categories did not differ in terms of PP or MP they can be grouped to perform training activities involving anaerobic power and capacity.
ACKNOWLEDGMENTS
The author was supported by a FAPESP grant (2017/08167-2) and a CNPq grant (302242/2014-7).
Notes
CONFLICT OF INTEREST
No potential conflict of interest relevant to this article was reported.