The Functional Movement Screen total score and physical performance in elite male collegiate soccer players
Article information

Abstract
The objectives of this study were to compare the differences in physical performance of elite male collegiate soccer players according to the Functional Movement Screen (FMS) total scores and to investigate the association between the FMS total score and physical performance. A total of 20 elite male collegiate soccer players (mean age, 19.6±0.7 years; height, 173.4±4.4 cm; body weight, 66.9±7.3 kg; and body mass index, 22.0±2.0 kg/m2) participated in the present study. The subjects were divided into two groups: the high FMS (FMS total score ≥14 points, n=10) and low FMS (FMS total score <14 points, n=10). All participants completed 10-m and 30-m sprint tests, the arrowhead agility test (right and left), and a coordination test. The statistical methods used to verify the study results were the independent sample t-test and Kendall’s Tau b correlation test. There were significant differences between the high and low FMS groups in the 10-m (P=0.014) and 30-m sprint (P=0.002) and arrowhead agility tests (right, P=0.039). Conversely, there were no significant differences in the arrowhead agility (left) and coordination tests between the two groups (P>0.05). Moreover, the FMS total score was found to have significant negative correlations with the 10-m sprint (r=−0.444, P=0.017), 30-m sprint (r=−0.425, P=0.016), and arrowhead agility tests (right, r=−0.389, P=0.023). These results suggest that higher FMS total scores could have a positive effect on the physical performance of the players.
INTRODUCTION
Soccer is a sport in which combinations of various physical fitness, including sprinting, changing direction, dribbling, walking, and running, occur repeatedly over a 90-min period (Lehance et al., 2009). To perform these actions at a high level, it is important to create optimal movement patterns based on the core, balance, range of motion, and coordination (Imai et al., 2014; Myer et al., 2005). However, poor movement patterns produce unfavorable biomechanical outcomes, which could ultimately increase the likelihood of minor or major injury (Cook et al., 2014), while also having a negative impact on the physical performance during matches (Chapman et al., 2014).
The Functional Movement Screen (FMS), which was developed by a physical therapist, Gray Cook, is a tool used to assess functional movement deficiencies based on proprioception, mobility, and stability (Cook et al., 2014; Frost et al., 2012; Kiesel et al., 2007). The FMS test is widely used for onsite assessment, owing to its characteristics of being low cost, simple, and noninvasive (Atalay et al., 2018). Surveys have confirmed that the FMS is the most commonly used method for establishing injury prevention strategies or testing injury risk in players belonging to soccer leagues in the United States and Australia (McCall et al., 2014).
Some studies have reported that low FMS total scores are associated with increased risk of injury (Chorba et al., 2010; Kiesel et al., 2007). According to Kiesel et al. (2007), there is a high likelihood of a serious injury to professional football players having an FMS total score of ≤14 points. Additionally, Chorba et al. (2010) reported that the risk of lower extremity injury increased by 4-fold in athletes with an FMS total score of ≤14 points. Therefore, the FMS total score has thus far been used as a predictor of injuries among athletes, and several studies have investigated its association with injuries (Bonazza et al., 2017; Mokha et al., 2016; Smith and Hanlon, 2017).
In contrast, it is still questionable as to whether the FMS total scores of athletes are actually associated with their physical performance. While some studies suggest that athletes’ FMS total scores of are significantly associated with their physical performance (Atalay et al., 2018; Lloyd et al., 2015), others have reported contradicting results, indicating no association between the two (Silva et al., 2017). Moreover, these studies were based on populations that differed greatly from one another, for example, the participants investigated by Atalay et al. (2018), Silva et al. (2017), and Lloyd et al. (2015) consisted of handball players, surfers, and young soccer players aged 11–16 years, respectively.
Accordingly, the objectives of the present study were to compare the differences in physical performance of elite male collegiate soccer players according to FMS total scores and to investigate the association between the FMS total score and physical performance.
MATERIALS AND METHODS
Subjects
The study population consisted of 20 elite male collegiate soccer players (mean age, 19.6±0.7 years; height, 173.4±4.4 cm; body weight, 66.9±7.3 kg; and body mass index, 22.0±2.0 kg/m2) from Munkyung College (Mungyeong, Korea). The subjects had no musculoskeletal injuries in the upper or lower extremities at the time. Each subject had the objectives and procedures of the study explained to them and voluntarily signed an informed consent form. The subjects were divided into two groups: the high FMS (FMS total score ≥14 points, n=10) and low FMS (FMS total score <14 points, n=10) groups. The characteristics of the subjects are shown in Table 1.

Characteristics of the subjects
The Functional Movement Screen
The official tool for the FMS (Functional Movement Screen Test Kit, Functional Movement System, Chatham, VA, USA) was used to measure (a) deep squat, (b) hurdle step, (c) inline lunge, (d) shoulder mobility, (e) active straight leg raise, (f) trunk stability push-up, and (g) rotary stability (Fig. 1). When shoulder mobility, trunk stability push-up, and rotary stability were being measured, clearing tests were performed together. Cook et al. (2014) were referenced for the detailed measurement methods for each variable. The motions involved in each movement were performed repeatedly, three times each, and the motion of the subject was graded on a scale of 0–3 points. The FMS scoring criteria were as shown in Table 2. The maximum possible score by the FMS was 21 points and the measurements were taken by an FMS specialist with several years of experience.
Seven tests of Functional Movement Screen.
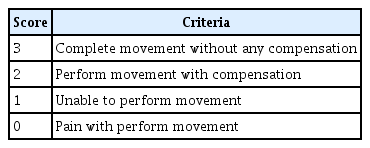
Functional Movement Screen scoring criteria
Physical performance
In this study, physical performance was measured based on 10-m and 30-m sprints, agility, and coordination. For accurate measurements, electronic timing devices (Brower TC, Brower Timing Systems, Draper, UT, USA) embedded with automatic sensors were used which were set up on the start and finish lines. All items were measured by a single researcher to ensure reliability of measurements. Prior to the measurements the subjects performed 20 min of warm-up exercises including running. For all measurements and procedures, Joo (2016) and Lockie et al. (2018) were referenced.
10-m and 30-m sprint test
The subjects waited in standing position 50 cm behind the start line before starting, and when signaled by the researcher, they sprinted at full speed to 10-m and 30-m and crossed the finish line. The 10-m and 30-m sprint times were measured twice each, and the fastest time for each distance was used as the final record.
Arrowhead agility test
The subjects waited 50 cm behind the start line in standing position before starting. When signaled by the researcher, they started towards cone A, which was placed 10 m away; moved to cone B located 5 m away; moved back to cone C; and crossed the finish line (Fig. 2). The same method was used for testing both the left and right sides. Each test was performed twice, and the fastest time recorded for each participant was used.
Arrowhead agility test.
Coordination test
The subjects waited standing 50 cm behind the start line before starting, and when signaled by the researcher, they passed all the cones while dribbling a ball. Once they reached the final cone, they went back to the start line, dribbling the ball in the same manner (Fig. 3). If a subject touched a cone or did not pass through properly, a penalty of 2 seconds was added to their total. The test was performed twice, and the fastest time noted for each participant was used.

Coordination test.
Statistical analysis
The results are expressed as mean±standard deviation. Independent sample t-tests were performed to compare the differences in the characteristics of participants and physical performance (10-m and 30-m sprints, agility, and coordination) between the two groups according to the FMS total scores. Moreover, Kendall’s Tau b correlation test was performed to analyze the association between the FMS total score and physical performance (10-m and 30-m sprints, agility, and coordination). Statistical analyses in the study were performed using IBM SPSS Statistics ver. 21.0 (IBM Co., Armonk, NY, USA) with the statistical significance level set to 0.05.
RESULTS
The results of comparing the differences in physical performance according to the FMS total scores were as shown in Table 3. The results showed statistically significant differences for the 10-m (P=0.014) and 30-m sprint tests (P=0.002) and the arrowhead agility test (right, P=0.039) between the two groups. The high FMS group showed faster sprint and arrowhead agility (right) tests results than the low FMS group. However, there were no significant differences in the values for arrowhead agility (left) and coordination tests between the two groups (P>0.05).

Results of comparing the differences in physical performance according to the Functional Movement Screen (FMS) total scores
The association between the FMS total score and physical performance were analyzed by Kendall’s Tau b correlation test (Table 4). The 10-m (r=−0.444, P=0.017) and 30-m (r=−0.425, P=0.016) sprint tests and the arrowhead agility test (right, r=−0.389, P= 0.023) showed significant negative correlations. In contrast, the FMS total score did not show a significant correlation with the arrowhead agility (left, r=−0.241, P=0.157) and coordination tests (r=−0.123, P=0.469).

Correlation between Functional Movement Screen (FMS) total score and physical performance
DISCUSSION
In the present study, differences in physical performance of elite male collegiate soccer players according to the FMS total scores were compared and the association between the FMS total score and physical performance was investigated. We found that players with higher FMS total scores had faster records in the 10-m and 30-m sprint tests and the arrowhead agility test (right), and these physical performance factors were found to be significantly associated with the FMS total score.
In soccer, sprinting is one of the most commonly performed actions before scoring (Haugen et al., 2014). In a typical soccer match, approximately 96% of sprinting involves a distance shorter than 30 m (Bangsbo, 1994). The motion of sprinting involves the participation of various biomechanical factors throughout the body (Mero et al., 1992), while efficient and fast execution of sprint action requires not only strength but also sufficient mobility and stability (García-Pinillos et al., 2015; Nesser et al., 2008; Seitz et al., 2014). The FMS is a tool designed to assess movement, and the individual tests included in the FMS have a balance between mobility and stability as a basic requirement (Lee et al., 2018). Therefore, higher FMS total scores could have a positive effect on sprint time records. Movements performed in some FMS tests have the same characteristics required for sprinting in soccer. The deep squat in the FMS is involved in power movements of the lower extremities, while the hurdle step involves proper stride mechanics in the stepping motion, along with mobility and stability of the hips, knees, and ankles (Cook et al., 2014).
Meanwhile, soccer players change running direction every 2–4 seconds, and a total of 1,200–1,400 times during a single match (Turner and Perry, 2014). Accordingly, it can be viewed that agility is important to effectively execute such movements that are required frequently during a match. In the present study, higher FMS total scores were associated with higher values in the arrowhead agility test, which was consistent with the findings of Atalay et al. (2018) and Lloyd et al. (2015). Atalay et al. (2018) reported that the FMS total scores for handball players have a significant negative correlation with the Illinois agility test values. According to Lloyd et al. (2015), reactive agility of soccer players has a significant negative correlation not only with the FMS total score, but also with deep squat, hurdle step, and in-line lunge scores. For agility, muscle quality in the lower extremities, especially left-right muscle imbalance, is important. According to Young et al. (2002), muscle imbalance in the lower extremity has a negative impact on changing direction with speed. The deep squat, hurdle step, and in-line lunge tests in the FMS are all designed to assess muscle imbalance in the lower extremities. In the present study, the high FMS group showed higher scores in these tests, which had a positive impact on the arrowhead agility test (right) values.
However, there were no significant differences between the two groups for the coordination test, while also showing no significant association with the FMS total score. It is believed that such results could be attributed to the fact that, unlike other tests, the coordination test was the only test that required the players to dribble the ball during the test, and as a result, technical factors involved in controlling the ball may have had a bigger influence on the results than basic movements of the players. Because all subjects in the present study were elite level players who have participated in soccer training for a several years, there should have been no major differences in technical factors. Such aspects should be examined in future studies.
The present study had some limitations. Firstly, the present study included only elite male collegiate soccer players; thus, it may be necessary to conduct studies with subjects with diverse characteristics, including sex, age, and/or skill level (amateur or professional). Secondly, the measurement and assessment of physical performance in the present study were focus only on on-field performance. For example, muscle strength measurement or motion analysis using an isokinetic dynamometer and tensiomyography in laboratory settings were not performed in the present study. Such limitations should be addressed in future studies.
Our findings suggest that a higher FMS total score in players could have a positive impact on their physical performance. Therefore, it is necessary for coaches and trainers to perform the FMS measurements and assessments on the field to closely monitor the FMS total scores of the players. For players with low FMS total scores, training programs designed to take corrective measures on functional deficiency or asymmetric movement patterns should be implemented to help improve physical performance.
Notes
CONFLICT OF INTEREST
No potential conflict of interest relevant to this article was reported.
ACKNOWLEDGMENTS
This paper was supported by Woosuk University.