Comparison of field- and laboratory-based estimates of muscle quality index between octogenarians and young older adults: an observational study
Article information

Abstract
Muscle quality (the ratio of strength to lean muscle mass) might be a better indicator of muscle function than strength alone. Differences in muscle quality index (MQI) between octogenarians and young older adults remain unclear. The aims of the present cross-sectional study were to compare (1) MQI between octogenarians and young older adults, (2) lab versus field-based MQI tools, and (3) determine possible confounding factors affecting MQI in older adults. Compiled data from two cross-sectional studies included 175 younger and older adults (31 men and 144 women) with a mean age of 75.93±9.49 years. Participants with age ≥80 years old were defined as octogenarians (n=79) and <80 years was defined as young older adults (n=96). Laboratory MQI was derived from the ratio of grip strength to arm muscle mass (in kg) measured by dual-energy x-ray absorptiometry. Field-based MQI was quantified from the ratio of grip strength to body mass index (BMI). Octogenarians displayed lower field (P=0.003) and laboratory MQI (P<0.001) as compared with young older adults. There was a strong correlation effect between field MQI and laboratory MQI (P=0.001, R=0.85). BMI (P=0.001), and diabetes mellitus (P=0.001) negatively affected MQI. Women presented lower MQI (P=0.001) values than men. In light of this information, rehabilitation specialists should consider the use of field-based MQI as a tool for evaluation and follow-up of older population.
INTRODUCTION
More comprehensive evaluations of muscle quality using noninvasive methods in older adults were specifically discussed and highlighted at the multidisciplinary workshop of “Sarcopenia and Physical Performance in Old Age” in 1996 (Dutta et al., 1997). Since then, muscle quality index (MQI) has been recognized as a sensitive surrogate measure of overall health and mortality in the community-dwelling older adults, similarly to strength of quadriceps and hand musculature (Brown et al., 2016; McGregor et al., 2014; Newman et al., 2006; Park et al., 2006; Rijk et al., 2016; Smith et al., 2019; Wang et al., 2020).
The MQI is defined as the ratio of muscle force (kg) and fat-free mass (or an alternative unit of muscle mass) and describes the physiological functional capacity of muscle tissue (Fragala et al., 2015). This measure provides an estimate of the contribution of neuromuscular factors affecting muscle strength, as well as an evaluation of the loss of muscle strength with aging (Barbat-Artigas et al., 2012; Goodpaster et al., 2006). Likewise, MQI has been linked to several health outcomes including physical function (specifically muscle) and the potential for developing metabolic disease in older adults (Barbat-Artigas et al., 2012; McGregor et al., 2014; Straight et al., 2015). Furthermore, age-related changes in MQI might be a better indicator for physical performance in older adults than global “strength,” as this often only reflects the quantity of muscle mass (Brown et al., 2016; Park et al., 2006).
Considering the assumptions that muscle mass is positively associated with muscle strength, a previous study demonstrated that muscle quantity is not synonymous with muscle quality, as independently of appendicular skeletal muscle index, older aldults with high muscle quality usually displayed low risks of functional performance (Barbat-Artigas et al., 2013b). Suggesting that having a high muscle quality, rather than great muscle mass, might be preferable (Barbat-Artigas et al., 2013b).
One must collect data on muscle mass, strength, and/or power to quantify MQI. However, standardized methods in quantifying MQI remain debated by experts (Barbat-Artigas et al., 2012; Chiles Shaffer et al., 2017; Fragala et al., 2015). We must consider that multiple methods of measuring skeletal muscle mass are available for research and clinical purposes that vary in cost and availability (Heymsfield et al., 2015; Fragala et al., 2015). The discussion of MQI collection in a lab or the field continues by weighing sensitivity and cost of assessment.
Clinical different muscle strength indexes have been reported and associated with functional performance in older adults and among these indexes, lab-based method (dividing handgrip strength by upper limbs muscle mass) and field-based method (dividing handgrip strength by body weight) were reported (Barbat-Artigas et al., 2013a). One investigation evaluated the relationship between physical function and MQI in older adults using field-based methods (normalized handgrip strength by body mass index [BMI]) (Straight et al., 2013). The study concluded that a field-based method for estimating MQI provides a similar prediction of physical function in community-dwelling older adults to a laboratory-based data (normalized leg power [watts] by lower body mineral-free lean mass).
Others reported that the use of handgrip strength relative to appendicular lean mass divided by BMI was equally acceptable when compared MQI data calculated with an expensive laboratory alternative (computed tomography) (Chiles Shaffer et al., 2017; Straight et al., 2013). Expensive laboratory methods were no better at correlating the measures of mobility or lower extremity performance than measures of MQI based on handgrip strength (Chiles Shaffer et al., 2017; Straight et al., 2013).
In line with results of previous studies (Barbat-Artigas et al., 2013a; Chiles Shaffer et al., 2017; Straight et al., 2013), the reader should keep in mind that the purpose of our analysis is to verify whether field-based and laboratory-based measures would be associated. Furthermore, provide a means of assessing MQI that is relatively accessible in a clinical setting and would be both convenient and effective for rehabilitation specialists.
Some confounding factors might potentially have a negative impact on MQI, such as age, physical activity, sex hormones, muscle size, fiber type, muscle architecture, aerobic capacity, adipose tissue, fibrosis, and neuromuscular activation (Barbat-Artigas et al., 2013a). Prior research comparing the MQI of male and female older adults with and without diabetes mellitus reported a lower leg and arm MQI in older adults with diabetes when compared to older adults without diabetes (Park et al., 2006).
Additionally, age-associated differences in upper body MQI revealed a greater decline in men than in women (Lynch et al., 1999). It was also noted that an elevated BMI had a detrimental effect on muscle quality due to greater levels of fat infiltration on muscle (Cooper et al., 2014). Further investigation on MQI and comorbidities should continue across age groups, sex, and disease state.
To note, age-associated loss of muscle quality plays an important role in the loss of strength as we age (Goodpaster et al., 2006); this was confirmed by a report identifying lower muscle quality in older adults (>75 years) when compared to middle-aged participants (Fukumoto et al., 2015). Clinicians may be interested in determining if confounding factors that affect muscle quality differ in octogenarians and young older adults to allow targeted interventions.
There are limited data on the MQI of octogenarian’s and consequently, little is known about the differences when compared with those young older adults. Given the association between field and laboratory approaches to estimate MQI, it is important to determine whether there is an association between handgrip strength normalized by BMI and handgrip strength normalized by fat-free mass.
The purpose of the present study was to compare the MQI measured by field-based and laboratory-based approach between octogenarians and young older adults and to determine possible confounding factors affecting MQI in older adults. The initial hypothesis was that field-based and laboratory-based measures would be strongly associated. We also hypothesized that octogenarians would have lower MQI as compared to younger older adults. We also examined whether BMI, presence of diabetes, and age would be confounding factors for MQI.
MATERIALS AND METHODS
Study design and participants
Data were compiled from two separate cross-sectional studies. The total sample included 175 healthy older adults (31 men and 144 women) with a mean age of 75.93±9.49 years. Strength was gathered from handgrip assessment and muscle mass from dual-energy x-ray absorptiometry (DXA) exams. In this study, participants 80 years of age or older were defined as octogenarians, with those younger than 80 years named young older adults. There were 27 (15.4%) and four men (2.3%) in the octogenarians and young older age groups, respectively. Furthermore, there were 52 (29.7%) and 92 women (52.6%) in the octogenarians and young older age groups, respectively. Self-reported hypertension was assessed to determine hypertension status and diabetes was defined as documented prescription of insulin or other hypoglycemic medications (Alonso et al., 2005; Ning et al., 2016; Nishime et al., 2000). Both study 1 (approval number: 50075215.2.0000.0029) and study 2 (approval number: 45648115.8.0000.5650/2016) were approved by the local Institutional Research Ethics Committee of Catholic University of Brasília. The study design and procedures were in accordance with ethical standards and the Declaration of Helsinki. Each participant was fully informed about the risks associated with study participation and gave their written informed consent. This study was performed in accordance with STROBE (Strengthening the Reporting of Observational studies in Epidemiology).
Study 1
The first set of data is part of cross-sectional study and included 227 octogenarian, men and women in seeking outpatient hospital services between March 2016 and May 2018. Volunteers who were unable to stand upright with or without assistance and those with a physical disability that prevented independent walking (such as lower limb amputations, hemiplegia, or stroke sequel) were excluded. Data from 140 participants were excluded as either handgrip strength or DXA data were unavailable; data from 87 participants remained.
Study 2
A total of 157 older women were recruited from a community located near the university. To be eligible for participation, women needed to be aged 60–100 years and volunteers who were unable to stand upright with or without assistance and those with a physical disability that prevented independent walking (such as lower limb amputations, hemiplegia, or stroke sequel) were excluded. Of those, 69 were excluded (handgrip strength was not obtained) leaving 88 participants who met the inclusion criteria. Data were collected between February 2016 and December 2017.
Handgrip strength
The handgrip strength was assessed using validated handgrip Hydraulic dynamometers (Jamar, Model 5030J1, Sammons Preston Rolyan, Dolgeville, NY, USA and Saehan Corp., Model SH5001, YangdeokDong, Masan, Korea) (Iconaru et al., 2018; Roberts et al., 2011). For study 1, the elbow was maintained in 90° flexion and verbal encouragement was used. Three measures on the dominant hand were obtained and the highest value was recorded (Roberts et al., 2011). For study 2, three measures on the right and left hand were obtained and the highest value was recorded. The second handle position was used for all the participants while holding the forearm in a neutral position and elbow fully extended. Participants were in a standing position and verbal encouragement was used for all participants with 1-min rest intervals between measurements. The validity and reliability of handgrip strength methods have been previously reported (Iconaru et al., 2018; Roberts et al., 2011).
Muscle quality
Laboratory MQI in both cross-sectional studies used the ratio of grip strength to the entire arm muscle in kilograms measured by DXA (Murai et al., 2018). Field MQI used the ratio of grip strength by the BMI (Barbat-Artigas et al., 2012; Choquette et al., 2010; Straight et al., 2013; Studenski et al., 2014). The validity and reliability of the MQI measures (field and laboratory) have been previously reported and the definition of muscle quality adopted in this study is commonly used in large-scale studies because of its convenience (Barbat-Artigas et al., 2012; Barbat-Artigas et al., 2013a; Choquette et al., 2010; Murai et al., 2018; Straight et al., 2013; Studenski et al., 2014).
Body composition
Anthropometric status in both cross-sectional studies was evaluated by the following measures: height (to the nearest 0.1 cm) and body weight (to the nearest 0.1 kg). Height and weight were used to calculate BMI (body weight/height2). Body fat percentage and fat-free mass were determined by using Lunar Prodigy whole-body scanner (GE Medical Systems, model 8548 BX1L Rommelsdorf, Germany) in conjunction with Encore Software 2005. Skeletal muscle mass was based on appendicular skeletal muscle mass (ASM) measures. ASM corresponds to the sum of two upper and lower limb muscle masses in kilogram. Calibration of DXA was provided, and phantom was used to check calibration daily, before body composition evaluation. The tests included a complete body scan of the volunteers, in the supine position, with the apparatus calibrated and operated by a technically trained professional. The legs were secured by nonelastic straps at the knees and ankles, and the arms were aligned along the trunk with the palms facing the thighs. All metal objects were removed from the participant before the scan.
Statistical analysis
Differences in means and proportions of baseline characteristics and body composition by age status were tested using Student t-tests and chi-square tests. In addition, a Pearson correlation was used to test the association between field MQI and laboratory MQI. A correlation greater than 0.8 was considered a strong effect (Ferguson, 2016). A hierarchical multiple regression was run to predict MQI from age (octogenarians vs. young older adults), fat (%), BMI, gender (male vs. female), hypertension (yes vs. no), and diabetes mellitus (yes vs. no). Considering that heteroscedasticity was confirmed by visual inspection of a plot of studentized residuals versus unstandardized predicted values, the weighted least-square regression was used. A moderation regression analysis was conducted to verify the effect of body fat percentage (predictor) on MQI, considering the age as the moderator variable. Considering that, three predictors in model 1 alone accounted for 51% of variation, thus, 0.51. Including the six predictors in model 2 increased the proportion of variance explained to 58%, thus 0.58. We calculated the post hoc power of the test for the increase due to the inclusion of model 2, given α=0.05 and a total sample size of 175 participants. The power was 0.99 for linear multiple regression. All analyses were conducted with SPSS ver. 18.0 (SPSS Inc., Chicago, IL, USA) and power was calculated using the G*Power 3.1.6 (Faul et al., 2007).
RESULTS
Participants meeting exclusion criteria or with missing values were excluded from the analysis (Fig. 1). Tables 1 and 2 display physical characteristics for this study’s sample. Octogenarians displayed lower BMI, body weight, lean mass, body fat, and handgrip when compared with young older adults, however displayed a higher ASM (Table 1). A chi-square test for association was conducted between age status and disease (Table 2). All expected cell frequencies were greater than five. There was no statistically significant association between age status and disease for hypertension χ2(1)=0.809, P=0.368. However, there was a statistically significant association between age status and disease for diabetes χ2(1)=31.812, P=0.001. Furthermore, octogenarians presented lower field (P=0.003) and laboratory MQI (P<0.001) as compared with young older adults (Fig. 2). There was a significant strong correlation between field MQI and laboratory MQI measures (P=0.001, R=0.85) (Fig. 3).
Flow diagram. DXA, dual-energy x-ray absorptiometry.

Participants’ characteristics
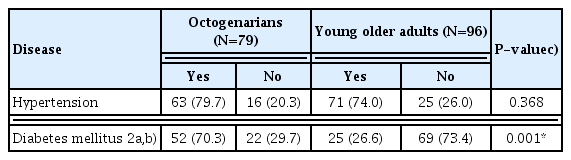
Disease characteristics in octogenarians and young older adults groups
Muscle quality index (MQI) measured by grip strength between octogenarians and young older adults. MQI measured by grip strength. *P<0.05.
Correlation analysis between field and laboratory muscle quality index (MQI) measured by grip strength. MQI measured by grip strength.
The full model of age, body fat percent, BMI, gender, and diabetes mellitus to predict MQI (model 2) was statistically significant, R2=0.51, F(6, 161)=28,84, P<0.001. See Table 3 for full details on each regression model. The value of the slope coefficient of the full model for age is 1.69, meaning, the predicted MQI for young older individuals is 1.69 greater to that predicted for octogenarians (with all values for all other independent variables being held constant). See Table 3 for full details on each regression model.
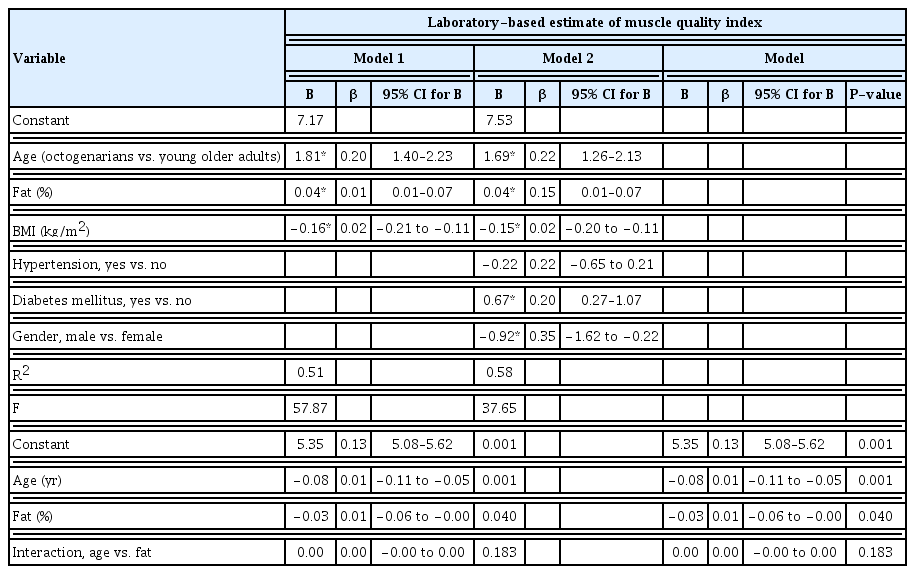
Hierarchical multiple regression predicting muscle quality index from age (octogenarians vs. young older adults), fat (%), BMI, gender (male vs. female), hypertension (yes vs. no), and diabetes mellitus (yes vs. no) stratified by laboratory- and field-based estimate of muscle quality index measured by grip strength (n=75)
The value of the slope coefficient of the full model for fat is 0.04. As such, an increase in percent body fat of one unit is associated with an increase in MQI of 0.04 kg/upper body fat-free mass (kg). Refer back to Table 3 for full details on each regression model. The value of the slope coefficient of the full model for BMI is −0.15. As such, an increase in BMI of one unit is associated with a decrease in MQI of −0.15 kg/upper body fat free mass (kg).
The value of the slope coefficient of the full model for diabetes mellitus is 0.67. This means that predicted MQI for participants without diabetes mellitus is 0.67 superior to that predicted for participants with diabetes mellitus (with all values for all other independent variables being held constant). See Table 3 for full details on each regression model. The value of the slope coefficient of the full model for gender is −0.94. This means that predicted MQI for older female adults is −0.94 inferior to that predicted for male older adults (with all values for all other independent variables being held constant). See Table 3 for full details on each regression model.
There was no significant interaction between age and body fat percent. However, with a lower age, there is a significant negative relationship between fat and MQI, b=−0.05, 95% confidence interval [CI] (−0.11 to −0.00), P=0.05. When age is higher, there is a no negative relationship between fat and MQI, b=−0.01, 95% CI (−0.04 to 0.02), P=0.53. Besides, young older adults present a higher MQI even with a higher body fat percentage (Fig. 4).
Moderation regression analysis between body fat percentages (predictor) on muscle quality index (MQI) measured by grip strength, considering the age as the moderator variable. MQI measured by grip strength.
DISCUSSION
The current study provides several new findings: (1) Octogenarians display lower field and laboratory MQI than young older adults; (2) Age status (octogenarians vs. young older adults), fat, BMI, diabetes mellitus, and gender affect MQI; (3) there was a strong relationship between field MQI and laboratory MQI, thus confirming the initial hypotheses.
To the authors’ knowledge, this is the first study comparing field and laboratory-based estimates of MQI between octogenarians and young older adults. The results of the present study confirm that age negatively affects MQI and that changes might be explained by the increase in intermuscular adipose tissue, leading to fibrosis and impairing muscle function (McGregor et al., 2014). In addition, a previous study demonstrated that older women (>75 years) presented lower muscle quality identified by higher echo intensity on biceps brachii, quadriceps femoris, rectus abdominis, external and internal oblique, and transverse abdominis when compared with middle-aged and young older participants (65–67 years) (Fukumoto et al., 2015).
In addition, the results of the present study confirmed that muscle quantity is not synonymous with muscle quality. Octogenarians presented a higher ASM than young older adults, but a lower field and laboratory MQI. Suggesting that having a higher muscle quality, rather than great muscle mass, might be preferable for octogenarians older adults (Barbat-Artigas et al., 2013b).
An increase of one unit in body fat percentage was associated with an increase in MQI of 0.04 kg/upper body fat-free mass (kg). Nevertheless, when analyzing the interaction between age vs. fat, there is a significant negative relationship between fat and MQI in young older adults and not octogenarians. Also, BMI showed a negative association with MQI, echoing results from previous studies (Cooper et al., 2014; Murai et al., 2018).
A previous study (Cooper et al., 2014), examined the association of BMI as individuals aged beyond 15 years old. Their study demonstrated that a higher BMI was associated with lower muscle quality, even at younger ages. Though postulation, the detrimental effect of high BMI on muscle quality may be due to greater levels of intermuscular adipose tissue. This hypothesis may be confirmed in previous finding (Murai et al., 2018), in which patients with higher visceral fat accumulation tended to have lower muscle quality when compared with patients with lower visceral fat, and BMI was negatively associated with muscle quality.
However, a higher BMI in octogenarians with chronic diseases might introduce better outcomes compared with their young older adult counterparts. These observations have been referred to as obesity paradox (Hainer and Aldhoon-Hainerová, 2013) and assuming they are valid, call into question the practice of extrapolating BMI targets derived from general population to octogenarians older adult patients.
A previous study with normal weight, overweight and obese participants at a mean age of 66 years with chronic heart failure, BMI was a better indicator of lean body mass than of adiposity (Oreopoulos et al., 2010). Furthermore, BMI thus not account nutritional status, disease risk factors, and disability (Heymsfield and Cefalu, 2013), confirming that, BMI as a proxy for obesity may lead to incorrect assumptions about the relationship between adiposity and outcomes in octogenarians older adult patients.
Diabetes have profound effects on muscle quality, since insulin resistance, inflammation, oxidative stress, and advanced glycation end-products may independently affect muscle mass and strength (Mesinovic et al., 2019). A previous study demonstrated that the presence of diabetes did not cause declines in MQI in older men, however poor glycemic control (defined as glycosylated hemoglobin levels of ≥8.5%) was associated with significant risk of decreased muscle quality (Yoon et al., 2016). Given the relationship between decreased muscle quality and diabetes, other studies demonstrated that older adults with diabetes present lower MQI and the duration of diabetes (years) also negatively affects MQI (Murai et al., 2018; Park et al., 2006). Our study concurs with previous studies, there appears to be a negative effect of diabetes mellitus on MQI within octogenarians and young older female and male adults.
Gender was also an important predictor of MQI, as women presented lower MQI when compared to men. The results of the present study are in accordance with previously published data (Fragala et al., 2012). Their findings demonstrated that women had inferior, lower body muscle quality when compared to men. Moreover, a previously data (Lynch et al., 1999) demonstrated a linear decline in arm MQ for both men and women associated with age. The effects of gender on MQI suggest that the contribution to reductions on MQI may differ by sex or perhaps have an interactive effect. This concept between octogenarians and young older individuals has not been adequately investigated and is of importance to public health.
Given the role that MQI plays in function and by measuring MQI from a practical standpoint, may be a fast and inexpensive metric to identify individuals at risk of functional decline (Fragala et al., 2015; Martinikorena et al., 2016; Studenski et al., 2014). Certainly, the strong correlation between field MQI and laboratory MQI measures demonstrated that our hypothesis to identify an index that would be both convenient and effective concurs with previous studies (Chiles Shaffer et al., 2017; Straight et al., 2013)
The optimal method to quantify MQI is not clear, but MQI calculation varies in cost, complexity, and availability (Heymsfield et al., 2015). We chose to use a device more accessible to clinicians as it is simple to use and relatively inexpensive. This decision may be questioned by a previously data that identified a weak relationship between handgrip and leg strength, and handgrip may not be a proxy of muscle strength in the lower limbs (Felicio et al., 2014; Samuel et al., 2012; Yeung et al., 2018). This means that, calculation of MQI using handgrip strength may be a good proxy of upper body functional tasks in older adults. However, calculation of MQI using handgrip strength may be a crude and flawed index to provide lower extremities in performing activities of daily living. On the other hand, findings from previous studies demonstrated that the handgrip test is still a strong predictor of early mortality and should not be overlooked (Metter et al., 2002; Rantanen et al., 1999).
Despite those limitations previously reported, this study might have important public health implications. When considering previous studies, field-based estimates of muscle quality, such as handgrip normalized by BMI, should be considered a valid if not superior substitute for more costly burdensome measures of MQI (Chiles Shaffer et al., 2017; Straight et al., 2013; Studenski et al., 2014). Translational scientists may consider using MQI beyond a metric of muscle strength and may implement MQI as an indicator for physical performance in older adults (Brown et al., 2016; Martinikorena et al., 2016; Shin et al., 2012).
The interpretation of our data is not without limitations. First, our study was cross-sectional in design and unable to identify any causal relationship between study variables and outcomes. The amount of missing data in our study. Our findings are limited to a relatively small (N=175) convenience sample of healthy older adults. Furthermore, the measurement of handgrip strength between the first and second cross-section studies were different between the method and tool used to assess the outcome (Roberts et al., 2011). Finally, devices more accurate than DXA, such as magnetic resonance imaging may provide a better information of muscle quality (e.g., fat infiltration).
We would like to propose that field-based MQI be implemented as an intial assessment tool for older adults, due to the easy assess, cost, and relevance. Additional research should attempt to compare field and laboratory MQI measures to further characterize the potential role of field-based approaches in octogenarians and young older participants to predict future mobility limitations, prevent falls and subsequent adverse outcomes such as hospitalization.
In summary, octogenarians display lower field and laboratory MQI when compared with young older adults, which should be considered in the evaluation of older people, rather than using young older and octogenarians together. BMI, diabetes mellitus, and gender negatively affect MQI. Considering the importance of MQI on evaluating the physical function in older participants, these results highlight the need of maintaining muscle quality with age. Simpler field-based measures of MQI can be used in daily clinical practice, with special attention to those older than 80 years.
Notes
CONFLICT OF INTEREST
No potential conflict of interest relevant to this article was reported.
ACKNOWLEDGMENTS
The authors acknowledge the financial support from Fundação de Apoio a Pesquisa do Distrito Federal (FAP/DF) and Coordenação de Aperfeiçoamento de Pessoal de Nível Superior (CAPES - n°71/2013) on first cross-sectional study. The first author would like to thank his family and in particular his mother Rita Cunha and his son Nicolas Cunha.