Psychophysical condition of adolescents in coronavirus disease 2019
Article information

Abstract
This study investigated the prevalence of depression and levels of physical fitness in high school students during the coronavirus disease 2019 (COVID-19) pandemic. One hundred fifty participants were divided into four groups according to the number of days that they felt depressed due to the COVID-19 during the last 7 days: no-depression group (NDG, n=17), some-depression group (SDG, n=32), occasional-depression group (ODG, n=81), and most-depression group (MDG, n=20). Shuttle run for endurance capacity and standing long jump for muscle power were selected to estimate the states of type I and type II muscle fibers, respectively. This study found that the Center for Epidemiologic Studies Depression Scale score of MDG was significantly higher than those of other three groups. In addition, ODG and MDG showed the lowest interest in their school studies compared with other groups. Endurance capacity showed a significant difference among groups, whereas muscle power showed no significant difference among groups. In conclusion, this study suggests that higher levels of depression reflect a greater lack of interest in life and academics. Furthermore, lower endurance capacity appears to be associated with more severe levels of depression. This highlights the importance of maintaining type I muscle fibers through regular aerobic exercise.
INTRODUCTION
The coronavirus disease 2019 (COVID-19) is an infectious disease caused by severe acute respiratory syndrome coronavirus 2. COVID-19 outbreak has caused many deaths around the world (Viana and de Lira, 2020). Epidemics can lead individuals to experience psychological problems such as depression (Ko et al., 2006; Shultz et al., 2015). Some studies have shown that posttraumatic stress disorder is closely related to depression (Qu et al., 2014). According to a research study, after experiencing a traumatic event, individuals may make a negative assessment of the trauma and its sequelae (Ehlers and Clark, 2000). In this respect, maladjustment strategies can be adopted to maintain symptoms such as depression, anxiety, and strong negative emotions (Xu et al., 2018). Psychological depression and anxiety caused by the COVID-19 pandemic is not only negatively affecting people’s mental health, but also their physical condition.
In adolescents, this phenomenon is exacerbated by the difficulty of meeting with friends, teachers, and relatives who are very important for character formation. Psychological depression and anxiety and decreased health fitness may be severe in adolescents compared to other age groups, which is rapidly increasing among the younger generation. A sudden decrease in an individual’s psychophysical condition can lead to chronic diseases, as well as suicidal thoughts, so it is necessary to prepare countermeasures for this condition. This may be because adolescents have a more active tendency than other age groups. Contrary to the policies of advanced countries, the physical fitness test system in Korea is not properly functioning to improve the health of adolescents, as the number of hours allotted for school sports has decreased. In particular, Korea’s highly competitive educational climate that prioritizes academic studies over physical activity can increasingly lead to an inactive lifestyle resulting in a greater prevalence of various chronic diseases, including depression, among young people. Although the average adolescent today has improved their physique compared to the past, their physical fitness has decreased.
To reverse this phenomenon, special considerations for psychophysical rehabilitation are needed. In general, it is known in the academic world that physical activity and exercise that moves the body through repetitive muscle contraction lowers depression and improves health and fitness. However, no studies have been conducted regarding the type of physical fitness that has been most affected by the COVID-19 pandemic and which kind of exercise for improving psychophysical conditions should be recommended. Therefore, the purpose of this study was to investigate the level of mental depression and anxiety in high school students, and also to investigate the areas of physical fitness that have been affected by the lockdowns and social distancing measures taken in response to the pandemic. Ultimately, based on the results of this study, we would like to suggest what types of rehabilitation exercises can be applied to reduce depression and anxiety that can occur during the COVID-19 pandemic. This study outlines two major hypotheses: (a) Higher levels of depression will be associated with lower levels of physical fitness, and (b) Depression may also be related to physical fitness factors.
MATERIALS AND METHODS
Subjects
The survey for depression and anxiety symptoms was administered in two high schools from December 20, 2020 to January 7, 2021. The study sample consisted of 189 adolescents with a mean age of 16.0±0.28 years. All participants were recruited through the recommendation of teachers and took part in online classes. Prior to the study, participants received detailed explanations regarding the study procedures and were then asked to complete the survey. The exclusion criteria for this study were as follows: individuals who had taken part in offline classes; individuals with sensory disorders, such as visual or hearing problems; and those with a history of neurological disorders.
After excluding 30 of 189 eligible participants as shown in Fig. 1, the remaining 159 participants were given a question to measure their level of depression. During allocation and follow-up phases, nine students dropped out of the study. The group was classified by the number of days they felt depressed due to the COVID-19 during the last 7 days. That is, if a subject indicated in the item ‘I felt depression for less than 1 day,’ he or she was classified to no-depression group (NDG, n=17). If a subject indicated in the item ‘I felt depression for 1 to 2 days,’ he or she was classified to some-depression group (SDG, n=32). If a subject indicated in the item ‘I felt depression for 3 to 4 days,’ he or she was classified to occasional-depression group (ODG, n=81). If a subject indicated in the item ‘I felt depression for 5 to 7 days,’ he or she was classified to most-depression group (MDG, n=20). Complete subject characteristics are illustrated in Table 1.

Allocation of participants (consolidated standards for reporting of trials flow diagram). CES-D, Center for Epidemiologic Studies Depression Scale.
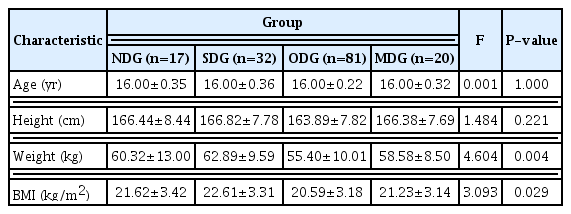
Physical characteristics of the participants
Experimental protocol
This was a cross-sectional study. All the procedures were explained in detail to all of the participants before they signed an informed consent form that was approved by Sahmyook University (2-1040781-A-N-012020085HR). All participant data was kept confidential and was only used for research purposes. Prior to the study, the principal investigator explained all the procedures to the participants in detail. The participants completed a self-reported questionnaire about their health status. To assess the levels of depression, the Center for Epidemiologic Studies Depression Scale (CES-D) was selected. To assess physical fitness, the shuttle run and the standing long jump were selected, in which both were performed without a mask.
CES-D questionnaire for assessing depression
This study used the CES-D which was developed by Radloff (1977). The scale is composed of 20 items to measure symptoms associated with depression. All items include four possible response options regarding how often the subject experienced the conditions described during the past 7 days as explained above. Out of a total of 20 questions, 16 questions use the aforementioned point scale, except for questions 4, 8, 12, and 16, which are counted in reverse order. The score is the sum of the 20 questions, which possible range is 0–60. If more than four questions are missing answers, do not score the CES-D questionnaire. The reliability of the questionnaire was 0.822, which was measured by calculating Cronbach α.
A score of 16 points or more is considered to be depressive (Hann et al., 1999; Radloff, 1977). However, a range between 0 and 20 points is considered normal, a range between 21 to 40 points indicate mild to moderate depression, and a range between 41 to 60 indicates severe depression in Korea (Chon et al., 2001).
Body composition
This study measured height in centimeters using a stadiometer. Body weight was measured in kilograms using a digital weight scale on which subjects stood on while clothed, but without shoes or other accessories. The body mass index is defined as the body mass divided by the square of the height and is universally expressed in units of kg/m2, resulting from mass in kilograms and height in meters. Commonly accepted body mass index ranges are underweight (under 18.5 kg/m2), normal weight (18.5 to 25 kg/m2), overweight (25 to 30 kg/m2), and obese (over 30 kg/m2).
Physical fitness tests
In this study, endurance running (shuttle run) was selected to assess the state of type I muscle fibers and the standing long jump was selected to assess the state of type II muscle fibers of physical activity promotion system (Korean Ministry of Education, 2021). Endurance capacity was measured by having the participants complete a 20-m shuttle run test, which is a commonly used aerobic fitness test. Required equipment includes a flat, nonslip surface, marking cones, measuring tape, audio, music player, and recording sheets. This test involved continuous running between two lines 20 m apart in time to recorded beeps. The subjects stood behind one of the lines facing the second line and began running when instructed by the recording. The speed at the start was slow. The subjects continued running between the two lines, turning when signaled by the recorded beeps. After about 1 min, the intervals between beeps became shorter, thus increasing the pace. This continued for each subsequent minute (level). If the line was reached before the beep, the students waited until the next beep before continuing. If the line was not reached before the beep, they were given a warning, but continued to run to the line, turned, and tried to catch up with the required pace within the next two beeps. They were given a warning the first time they failed to reach the line (within 2 m) and eliminated after the second warning. The score was the level and number of shuttles reached before they were unable to keep up with the beeps. 1 point was awarded each time the participant reached one of the two lines, and the total number was recorded as the final score. The examination was carried out while without wearing a mask.
Muscle power refers to the ability to exert maximum power in a short amount of time. The standing long jump is a test that measures the power required to move the body quickly and to jump as far as possible using type II muscle fibers. The test was done without wearing a mask. The subject begins at the starting line and then runs the maximum distance using the body’s recoil in place and the distance from the starting line to the landing point is measured. An instructor explained the method to the students and provided a demonstration. The students performed the standing long jump twice and the maximum distance between the two was recorded in 0.1 increments.
Statistical analysis
The sample size was determined using G*Power v. 3.1.9.7 (Faul et al., 2007; Faul et al., 2009), considering a priori effect size of f2 (V)=0.40 (large size effect), α error probability=0.05, power (1-β error probability)=0.95, and number of groups=4. Although the total numbers of three groups were calculated as 112 subjects, 150 subjects were recruited for this study. IBM SPSS Statistics ver. 22.0 (IBM Co., Armonk, NY, USA) was used to perform all statistical analyses, and the Shapiro–Wilk test was used to check the data distribution. A frequency analysis was conducted to find out how many days during a week they felt depressed due to COVID-19 for a total of 150 patients. Thereby, the group was classified into NDG, SDG, ODG, and MDG. Microsoft Excel (Microsoft, Redmond, WA, USA) was used to analyze the data, expressed as mean±standard deviation or as mean±standard error of the mean. Differences among the groups were observed using one-way analysis of variance. Where significant F-values were observed, Tukey post hoc test was applied to locate pair-wise differences. An analysis of covariance (ANCOVA) was also run for variables where there were baseline intergroup differences. Effect sizes were determined by converting partial eta-squared (ES) to Cohen d (Cohen, 1992); values were classified as small (0.00≤d≤0.49), medium (0.50≤ d≤0.79), and large (d≤0.80). The significance level was set a priori at P≤0.05 for all analyses.
RESULTS
Demographic and anthropometric characteristics
One hundred fifty participants were classified into four groups. At the baseline, all variables were recorded in Table 1. There were no significant differences in age and height among groups (Table 1). This study found that 11.3% of the participants did not feel mentally depressed, 21.3% felt depression for 1 or 2 days, 54% felt depression for 3 to 4 days, and 13.3% felt depression for 5 to 7 days in the last 7 days.
Comparative results of CES-D depression scale
The differences observed in the questions among groups are shown in Table 2. All specific questions from Q1 to Q20 were significantly different among groups. Specifically, the depression scores of MDG were significantly higher than those of other groups. These results were also confirmed by a post hoc test. The results of ANCOVA test also showed significant differences among groups and ES ranged from 0.109 to 0.498, which means small to medium effect sizes.

Comparative results of Center for Epidemiologic Studies Depression Scale
As shown in Fig. 2, total CES-D score of NDG was 8.94±1.34, SDG was 10.25±2.76, ODG was 17.20±3.83, and MDG was 31.15±4.37. It can be seen that total CES-D score of MDG was very high compared to the other three groups. The results of ANCOVA test showed significant differences among groups (F= 172.910; P<0.001; ES=0.782, medium effect size). Specifically, no academic interesting scores of NDG was 0.82±0.73, SDG was 1.34±0.70, ODG was 1.65±0.73, and MDG was 2.50±0.61. Statistical analysis showed significant differences between groups (F=19.186; P<0.001; ES=0.283, small effect size).
Comparisons of Center for Epidemiologic Studies Depression Scale (CES-D) (A) and academic interesting (B). Values are presented as mean±standard error of the mean. NDG, no-depression group; SDG, some-depression group; ODG, occasional-depression group; MDG, most-depression group; NS, not significant. Following analysis of variance test, Tukey post hoc analysis was conducted to specify depressive effect. F and eta-squared (ES) were gained from analysis of covariance test. a,b,c,dpost hoc symbols.
Comparative results of physical fitness
The data analyzed in the physical fitness test among groups are shown in Fig. 3A. Shuttle run, a form of endurance capacity, of NDG was 43.59±11.40, SDG was 37.16±9.08, ODG was 26.02±9.81, and MDG was 19.30±8.98. It can be seen that the running score of MDG was very low compared to the other three groups. The results of ANCOVA test showed significant differences among groups (F=27.662; P<0.001; ES=0.364, small effect size). According to the results of the post hoc test, subjects with more severe depression had less endurance ability. On the other hand, as shown in Fig. 3B, there was no significant difference among the groups in the standing long jump, which represents muscle power (F=0.675; P=0.569; ES=0.014, small effect size) not affected by mental depression.
Comparisons of shuttle run test (A) and standing long jump test (B). Values are presented as mean±standard error of the mean. NDG, no-depression group; SDG, some-depression group; ODG, occasional-depression group; MDG, most-depression group; NS, not significant. Following analysis of variance test, Tukey post hoc analysis was conducted to specify depressive effect. F and eta-squared (ES) were gained from analysis of covariance test. a,b,c,dpost hoc symbols.
DISCUSSION
This study found that the CES-D score of MDG was significantly higher than those of NDG, SDG, and ODG. In addition, MDG showed the lowest interest in their academic studies. Aerobic endurance capacity showed a significant difference among the groups, however, muscle power capacity showed no significant difference among groups. Specifically, this study found 67.3% of adolescents (ODG+MDG) showed tendencies of depression, and 13.3% of adolescents in MDG felt severely depressed. Considering the depression category of CES-D (more than 16 points) defined by Hann et al. (1999) and Radloff (1977), ODG and MDG of this study belong to the depression category. However, considering the depression categories (under 20, normal; 21 to 40, mild to moderate depression; 41 to 60, severe depression) of the Korean version of CES-D (Chon et al., 2001), only MDG of this study was found to have depression. In other words, the lockdowns and social distancing measures in response to the COVID-19 pandemic may have contributed to a higher prevalence of depression among adolescents in South Korea due to the decrease in physical and social activities. According to the results of this study, greater levels of depression was associated with lower levels of physical fitness. In particular, endurance capacity was significantly lower in ODG and MDG, compared with NDG.
The changes in daily life due to social distancing during the COVID-19 pandemic has resulted in a change in lifestyle. The largest lifestyle change in the COVID-19 pandemic has been reported to be an increased sedentary life pattern and thus reduced physical activity time (Pinto et al., 2020; Xiang and Zhang, 2020). Obesity increases as physical activity decreases (Rundle et al., 2020), while life satisfaction and happiness are constantly decreasing in this era. In fact, various psychological problems, including depression and anxiety, have been reported in countries affected by COVID-19 (Jiao et al., 2020; Schuch et al., 2020). Liang et al. (2020) investigated the factors that influence mental health problems among youth approximately 2 weeks after the COVID-19 lockdown. They reported that ~40% of the participants were suffering from psychological problems and ~14% were young men with symptoms of posttraumatic stress disorder. As mentioned above, ~67% of the adolescents surveyed in this study had moderate to severe symptoms of depression, with 13.3% indicating major depression. These results suggest that almost adolescents were unable to adapt to the changes caused by COVID-19 pandemic and lockdown.
This psychological depression increases physical inactivity, resulting in a decrease in overall physical strength. Among the physical factors, the reduction of type I muscle fibers, which is related to human metabolism and immune system (Jee, 2019; Jee, 2020a; Jee, 2020b; Jee, 2020c; Jee, 2021), is also related to the onset of various diseases, so care should be taken. Looking at the results of this study, there was no significant difference between the groups in the standing long jump driven by type II muscle fibers, regardless of depression levels. However, the shuttle run, which is mainly driven by type I muscle fibers, showed a tendency to decrease as depression tendencies grew stronger. Interestingly, wearing a mask was shown to have a significant difference only in the shuttle run (data not shown in this manuscript). In other words, wearing a mask, which must be worn due to social distancing, negatively affected endurance capacity by almost 50% in the shuttle run test.
Physical activity is a very important factor in the healthy development of adolescents, as well as throughout life (Telama et al., 2005). It is a key component of a healthy lifestyle that includes physical, mental, and social well-being (Bailey, 2006; Strong et al., 2005). Above all, a sedentary lifestyle is very harmful to the extent that it is the fourth leading cause of death, while physical activity is a factor that contributes to mental well-being, even during the COVID-19 pandemic (Maugeri et al., 2020). Physical exercise is a noninvasive and affordable activity that can protect the body from viruses by strengthening the immune system of adolescents (Jee, 2019; Jee, 2020a; Jee, 2020b; Sallis et al., 2020). Accordingly, exercise providers and medical researchers around the world are recommending regular physical activity to maintain a healthy life during the COVID-19 pandemic (Chen et al., 2020; Fallon, 2020). In addition, physical activity has been recognized for its effectiveness in improving adolescents’ physical, mental, and social health, as well as academic performance (Park et al., 2017; Strong et al., 2005).
The physical activity levels of Korean adolescents rank among the lowest in the world. Among the indicators related to physical activity in more than 50 countries around the world, the level of physical activity and sedentary behavior of Korean adolescents are reported as grades D and F, respectively (Tremblay et al., 2016). In general, much of an adolescent’s physical activity takes place in school. About 40% of the daily number of steps taken by adolescents occurs in school (Tudor-Locke et al., 2006), and physical education classes account for 11% to 34% of the daily moderate-vigorous-intensity physical activity (Wickel and Eisenmann, 2007). Physical activity after school provides a minimum of 7.5% of daily physical activity (Cheung, 2019) to a maximum of 50% (Tudor-Locke et al., 2006). In other words, a considerable amount of youth physical activity occurs in school.
In general, physical activity has declined during the COVID-19 pandemic. As described above, immune function and mental health can be improved through moderate to high-intensity physical exercise. Therefore, the guidelines for physical activity for adolescents during the COVID-19 pandemic should also be conducted daily from moderate to vigorous physical activity for at least 60 min (Cheung, 2019; World Health Organization, 2010), and cardiopulmonary function should be maintained through aerobic exercise (Chen et al., 2020). In this respect, schools should encourage adolescents to exercise regularly by promoting sports and other physical activities even through online classes. (Yu and Jee, 2021).
In conclusion, individuals with higher levels of depression tended to exhibit less interest in life and school studies. Lower levels of physical endurance were also seen in those with more severe signs of depression. Ultimately, the negative effects of depression in young subjects showed poorer physical fitness, which was observed in the decreased function of type I muscle fibers. However, this study has a few limitations. Due to the small sample size of this study, it would be beneficial for future studies to generalize the results with a larger number of subjects. Furthermore, it is necessary to examine more types of physical fitness and to investigate the effects of wearing masks on other psychophysical factors.
Notes
CONFLICT OF INTEREST
No potential conflict of interest relevant to this article was reported.
ACKNOWLEDGMENTS
The authors received no financial support for this article. We gratefully acknowledge all of the subjects who participated in this study.