Combined effects of whole-body vibration and dynamic squats on cardiovascular and salivary biomarker responses in healthy adults
Article information

Abstract
This study aimed to investigate the acute effects of combining whole-body vibration with dynamic squats on cardiovascular and salivary bio-marker responses in healthy adults. A randomized crossover design was conducted with 20 healthy adults. Each participant underwent three exercise sessions, with a 2-week washout period between each session. The sessions consisted of: (1) whole-body vibration (VB) at 25 Hz for 2 minutes, with an amplitude of 2 mm, and 2 minutes of rest between sets, for a total of 5 sets; (2) dynamic squats (SQ) performed 15 times within 2 minutes, with a 2-minute rest between sets, for a total of 5 sets; and (3) a combination of whole-body VB and SQ (VB+SQ). The cardiovascular variables and salivary biomarkers related to exercise intensity were assessed. Only the VB+SQ session significantly decreased the unstimulated salivary flow rate, and caused greater changes in heart rate, systolic blood pressure, mean arterial pressure, rate-pressure product, and heart rate variability compared to VB or SQ alone. Moreover, the VB+SQ session significantly increased the salivary total protein concentration from 0.56±0.05 mg/mL (baseline) to 0.74± 0.06 mg/mL (postexercise condition) and the salivary alpha-amylase activity from 33.83±5.56 U/mL (baseline) to 63.63±12.33 U/mL (postexercise condition) (P<0.05). These changes were recovered at 1-hr postexercise condition. Our findings provide information for designing exercise programs that incorporate VB+SQ to enhance hemodynamic and cardiac autonomic responses in healthy adults and for application during rehabilitation periods.
INTRODUCTION
Over the past 2 decades, whole-body vibration exercises (WBVEs) have been applied to different target groups, including the healthy population, patients with specific conditions, and athletes, to increase muscle strength, improve metabolic functions, stimulate bone mineralization, reduce pain, and increase agility (Cardinale and Wakeling, 2005; Pojskic et al., 2015). There are two types of commercially available vibration plates (VPs) that have been extensively used for vertical vibration and side-alternating vibration. Vibration variables such as frequency, amplitude or peak-to-peak displacement, gravitational force generation, duration of vibration, and rest interval between vibration sessions vary depending on the exercise protocol and influence the individual response.
Previous studies have showed the acute effects of WBVEs on physical fitness (Donahue et al., 2016; Gerodimos et al., 2010; Paradisis et al., 2021; Ronnestad, 2009; Ye et al., 2014). Performing whole-body vibration during muscle strength testing increases the force of muscle contraction in healthy adults (Ronnestad, 2009). Side-alternating vibration improves the flexibility of active women and this effect can be maintained for at least 15 minutes after the exercise session (Gerodimos et al., 2010). Vertical vibration increases trunk extensor strength in healthy male and female participants (Ye et al., 2014). Applying vertical vibration in the general warm-up phase improves the movement speed of the feet of active men (Donahue et al., 2016). Moreover, whole-body vibration also improves running economy by increasing the leg stiffness, maximal ground reaction force, and flight time of healthy college students (Paradisis et al., 2021).
Along with these effects on physical fitness, several studies have assessed the physiological responses to acute WBVEs (de Paula et al., 2021; Licurci et al., 2018; Mahbub et al., 2020; Wirth et al., 2011; Zeigler and Swan, 2016). The abdominal muscle activities recorded by surface electromyography are increased during WBVEs using vertical vibration in young healthy adults (Wirth et al., 2011). The WBVEs also influence the hemodynamics and cardiac autonomic function. The combination of vertical vibration with resistance exercise has been shown to reduce systolic blood pressure (SBP) and increase oxygen consumption more than conventional resistance exercise in adults with prehypertension (Zeigler and Swan, 2016). Exposure to acute side-alternating vibration increases the skin blood flow on the dorsum of the foot and vibrotactile sensation in older adults (Mahbub et al., 2020). Previous research has shown that combination of whole-body vertical vibration with squats (SQ) exerted greater changes in heart rate (HR), mean arterial pressure (MAP), rate-pressure product (RPP) in nonsarcopenic older adults (de Paula et al., 2021). Moreover, side-alternating vibration causes acute changes in the time domain of HR variability (HRV) by increasing the standard deviation of the beat-to-beat (NN or RR) interval (SDNN), root mean square of successive RR interval differences (RMSSD), and percentage of adjacent RR intervals differing by more than 50 msec (pNN50) corresponding to a decrease in the mean HR in older adults, whereas the frequency domain of HRV is not changed (Licurci et al., 2018). At the present, the study of cardiovascular responses to acute WBVEs in healthy adults including HR, blood pressure (BP), RPP, and cardiac autonomic function is still limited.
It is well known that the function of salivary glands is regulated by the autonomic nervous system composed of the parasympathetic and sympathetic nervous systems (Yoshizawa et al., 2013). Thus, modulation of autonomic function can alter salivary production and salivary composition (Pedersen et al., 2018). Unlike blood samples, the collection of salivary samples is noninvasive. Recently, measurement of salivary biomarkers related to exercise intensity have been extensively investigated (Backes et al., 2015; Justino et al., 2018; Souza et al., 2019). Depending on exercise intensity, salivary alpha-amylase (sAA) activity and salivary cortisol are changed (Backes et al., 2015). Salivary total protein concentration has a high correlation with HR and blood lactate in elderly elite athletes during incremental exercise test which is suggested that salivary total protein concentration can potentially be used as noninvasive method for determining anaerobic threshold in this population (Justino et al., 2018). In addition, high-intensity interval exercise, continuous exercise, and resistance exercise can induce changes in the salivary total protein concentration, sAA activity, and salivary nitric oxide (NO) (Souza et al., 2019). These parameters are recovered in 3-hr postexercise condition.
However, the effects of combining whole-body vibration with dynamic SQ, a widely recognized form of body weight resistance exercise, on salivary total protein concentration, sAA activity, and NO in healthy adults are still unknown. Thus, the present study aimed to examine cardiovascular response and noninvasively monitor salivary biomarkers related to exercise intensity to acute whole-body vibration with dynamic SQ in healthy adults.
MATERIALS AND METHODS
Participants
The sample size was calculated using G*Power software (Heinrich-Heine-Universität Düsseldorf, Düsseldorf, Germany) based on HR response and changes in salivary total protein concentration and sAA activity to WBVEs in our pilot study. This study was approved by the human research ethics committee of Chulabhorn Research Institute (project code 176/2564). The participants were recruited through an electronic poster and QR code, which included the details of research inclusion/exclusion criteria, exercise protocol, and essential information based on the human research ethics committee. The study cohort comprised 20 healthy adults with a body mass index (BMI) of 18.5–24.9 kg/m2 and age of 20–35 years who performed exercises of moderate intensity for less than 150 min/wk. The exclusion criteria were musculoskeletal problems or underlying diseases that affected the ability to do SQ or exercise on a vibration platform, previous severe acute respiratory syndrome coronavirus 2 infection, oral inflammation, current smoking status, and regular intake of antioxidant supplements. Prior to data collection, all participants were provided with the participant information sheet, observed a demonstration of the WBVE before performing the exercise intervention, and provided written informed consent for study participation.
Study protocols
To minimize the adverse side effects of transmission of vibration to the head, in this study, we preferred to use side-alternating VP rather than vertical VP. A randomized crossover design was used (Fig. 1). At the first visit, the participants were randomly assigned to perform one of three exercise sessions: vibration on a side-alternating VP (8N057410Q, Galileo, Novotec, Pforzheim, Germany), SQ, or vibration on a platform combined with SQ (VB+SQ). In our pilot study, 2-week washout period is sufficient to recover the participants from muscle fatigue, muscle soreness or any adverse symptoms related to exercise. After a 2-week washout period, the participants were assigned to perform one of the two remaining exercise sessions. At the last visit after the second washout period, the participants were instructed to perform the remaining exercise session.
The study design and protocol of this study. VB, whole-body vibration at 25 Hz on platform; SQ, squats on platform; VB+SQ, whole-body vibration at 25 Hz and squats on platform.
Measurement of the body composition
The participants had their body composition measured at each of the three separate visits before starting each exercise session. The Seca medical Body Composition Analyzer (5141321004, Seca GmbH & Co., KG, Hamburg, Germany) was used to measure the fat mass, fat-free mass, skeletal muscle mass, and total body water. The weight, height, and BMI were also recorded.
Exercise protocols
Prior to the exercise intervention, the exercise protocol was trialed and set based on our pilot study. The vibration frequency above 25-Hz exhibited stronger vibrations, and some participants were intolerant to exercise and easily fatigued, especially inactive adults. Conversely, lower frequencies at 20 or 15 Hz had lower challenges for participants to perceive exertion. The duration per set of vibration was also selected. The 2-min vibration time per set at 25 Hz is enough to increase HR and BP responses from baseline. Thus, vibration at a frequency of 25 Hz with a 2-min duration per set was used in this study. Participants performed exercise tests at least 2 hr after ingesting a meal and intaking an appropriate amount of water to maintain hydration. The participants were first instructed to do general warm-up exercises for 5 min, comprising three sets of forward-and-backward leg swings for 20 sec on each side, followed by marching in place for 3 min.
In the VB session, participants stood barefoot with their knees slightly bent on a side-alternating VP. They placed the inner edges of their feet near the second line markings on the platform, providing approximately 2 mm of vibration amplitude (Fig. 2A). In the SQ session, participants were instructed to perform SQ while being guided by an instructor, visual monitor, and a tool (Fig. 2B). The vibration frequency was set at 25 Hz for 2 min. After the 2 min of vibration, the participants rested on a comfortable chair for 2 min. They then repeated these steps 4 times to complete five sets of the exercise session (Fig. 3). They started in standing position with their bare feet positioned similar to the positions used in the VB program. They were then instructed to bend their knee to 90 degrees within 4 sec, followed by extending their knee to the starting position within 4 sec; this sequence was repeated 15 times in 2 min. The participants then rested for 2 min on a comfortable chair and repeated the steps 4 times to complete five sets of the exercise session (Fig. 3). In the VB+SQ session, participants were instructed to perform SQ during vibration on the plate. The protocol was set as described above in the SQ session (Fig. 3).
The setup of vibration plate and tools used in the exercise programs. (A) Line markings on the vibration plate. (B) Virtual instruction and tools used for performing squats.

The exercise protocol of this study. VB, whole-body vibration at 25 Hz on plateform; SQ, squats on plateform; VB+SQ, whole-body vibration at 25 Hz and squats on plateform.
Salivary collection, preparation, and storage
Unstimulated salivary samples were collected from the participants in 15-mL conical sterile polypropylene centrifuge tubes by the spitting method at 10 min before exercise (pre-exercise condition), after exercise (postexercise condition), and 1 hr after exercise (1-hr postexercise condition). These samples were transferred to sterile 1.5-mL microcentrifuge tubes and then centrifuged using a refrigerated centrifuge (TGL-16, UGAIYA Bio-Sciences Co., Ltd., Osaka, Japan) at 5,000 ×g, 4°C, for 40 min. The clear supernatant samples were transferred to other tubes and a protease inhibitor cocktail (HY-K0010, Medchemexpress LLC, Monmouth Junction, NJ, USA) was added to protect the protein from degradation. These samples were stored at −20°C until analysis within 3 months.
Measurement of the salivary flow rate and salivary pH
The conical sterile polypropylene centrifuge tubes, as mentioned above, were weighed before and after salivary collection to determine the salivary volume by assuming a salivary density of 1 g/mL. The salivary flow rate was calculated and expressed as mL/min. The salivary pH was determined by a pH meter (ECPH270042GS, Eutech Instruments Pty. Ltd., Keppel Logistic Building, Singapore).
Measurement of the cardiovascular variables
The SBP, diastolic BP (DBP), and HR in the pre-exercise condition were determined using an automated sphygmomanometer (2130, SunTech Medical, Inc., Morrisville, NC, USA). The MAP was calculated as DBP+1/3 (SBP–DBP), and the RPP (an indicator of myocardial oxygen consumption) (Ansari et al., 2012; Gobel et al., 1978) was calculated as (SBP×HR)/1,000. The cardiac autonomic function was determined by the HRV. The participants sat in a relaxed posture on a comfortable chair. The RR interval (beat-to-beat) was recorded at rest for 10 min using the Polar H10 (Polar Electro Oy, Kempele, Finland) synchronized with the Elite HRV application installed on an iPad (MUUK2TH/A, Apple Inc., Cupertino, CA, USA). Subsequently, the RR interval data were exported from the Elite HRV application and Kubios HRV standard software (Kubios Oy, Kuopio, Finland) was used to analyze the time domain, frequency domain, and nonlinear HRV.
The RR interval was recorded for the entire exercise session and continuously collected for another 10 min in the postexercise period. All data were exported from the Elite HRV application and further analyzed as described above. The SBP, DBP, MAP, and RPP data were collected immediately in the rest period between sets of the exercise program and the postexercise condition. The HRV data were recorded for 10 min in the 1-hr postexercise condition. The SBP, DBP, MAP, and RPP data were also collected during this time.
Chemicals
Bradford reagent (#5000006) and bovine serum albumin were purchased from Bio-Rad (Bio-Rad Laboratories, Inc., Hercules, CA, USA). 2-Chloro-4-nitrophenyl-α-D-maltotrioside was purchased from Cayman Chemical Company (Ann Arbor, MI, USA). All other chemicals with high purity were obtained from commercial sources.
Measurement of the salivary biomarkers related to exercise intensity
On the day of the experiment, the samples were thawed and centrifuged using a refrigerated centrifuge at 5,000×g, 4°C, for 10 min. The clear supernatant was transferred to a new microcentrifuge tube for analysis. The salivary total protein concentration is a biomarker of exercise intensity (Souza et al., 2019). It was quantified by the Bradford assay using Bradford reagent following the manufacturer’s instructions. Briefly, salivary samples were diluted and pipetted into 96-well clear plates. Assay reagent was added into each well before reading at an absorbance wavelength of 595 nm using a hybrid multimode microplate reader (Synergy H1MF, BioTek Instruments Inc., Winooski, VT, USA). The results were obtained using the standard curve of bovine serum albumin and expressed as mg protein/mL.
The sAA activity increases during physiological and psychological stress influenced by the sympathetic nervous system (Koibuchi and Suzuki, 2014). Thus, the sAA activity can be used as a biomarker of exercise intensity and sympathetic modulation (Koibuchi and Suzuki, 2014; Souza et al., 2019). The sAA activity was determined using a modified version of a previously described method (Souza et al., 2019). The samples were diluted to 1:200 in MES buffer containing 50 mM MES, 300 mM NaCl, 5 mM CaCl2, and 140 mM KSCN (pH 6.3). A 10-μL aliquot of the sample was pipetted into a 96-well clear plate before adding 300 μL of the preheated substrate and 2 mM 2-chloro-4-nitrophenyl-α-D-maltotrioside in MES buffer at 37°C into each well. Subsequently, the plate was read at baseline, 1 min, and 2 min at an absorbance wavelength of 405 nm at 37°C and the specific pathlength of each well was read using a hybrid multimode microplate reader. The baseline data (A0) and absorbance at 2 minutes (A2) were used to calculated the sAA activity using the following equation: ((A2/pathlength-A0/pathlength)/2×0.31×200)/(12.9×0.01) where the pathlength was specific to each well, 2 was the reading time from baseline in minutes, 200 was the dilution factor, 0.31 was the assay volume in mL, 12.9 was the millimolar absorptivity of the substrate, and 0.01 was the sample volume in mL. The data were expressed as U/mL.
For measurement of salivary NO concentration, NO is rapidly converted to its metabolites, and nitrite is used as an indicator of NO production during the exercise session (Souza et al., 2019). The salivary nitrite concentration was measured to determine the salivary NO production following a previously reported method (Souza et al., 2019). Briefly, the 50-μL diluted sample and an equal volume of Griess reagent were added into a 96-well clear plate. The absorbance of each well was measured at a wavelength of 570 nm using a hybrid multimode microplate reader. The results were obtained using the standard curve of sodium nitrite and expressed as μM.
Statistical analysis
The Shapiro–Wilks normality test was used to determine the normality of the data distribution. In comparisons of parametric data, the data are expressed as mean±standard error of the mean. Subsequently, one-way repeated-measures analysis of variance with Geisser-Greenhouse correction followed by Tukey multiple comparisons were applied for within-group comparisons. In comparisons of nonparametric data, the data are expressed as median (interquartile range). The Friedman test followed by Dunn multiple comparisons test were used for within-group comparisons. Statistical analysis was performed using GraphPad Prism (GraphPad Software, Inc., San Diego, CA, USA). Statistical significance was indicated by P<0.05.
RESULTS
Characteristics and body composition of participants
The study cohort comprised 20 participants (13 women and 7 men). The age, height, weight, BMI, and body composition are shown in Table 1. There were no significant differences in the weight, BMI, fat mass, fat-free mass, skeletal muscle mass, and total body water of the participants at the three separate visits, indicating that their body composition was maintained throughout the study period; this reduced the confounding factors of changes in body composition on the physiological and biochemical responses related to exercise.
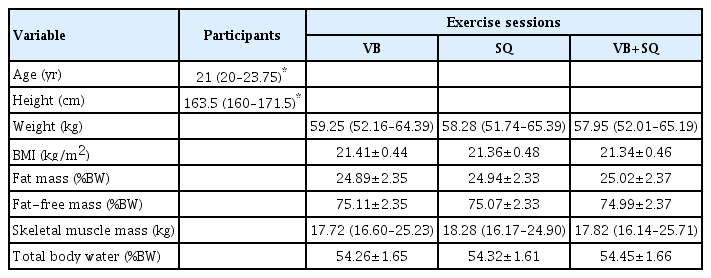
General characteristics and body composition of participants at the three separate visits (n=20)
Changes in the salivary flow rate and salivary pH caused by the three exercise sessions
As shown in Fig. 4A, the salivary flow rate was not changed in the postexercise condition of the VB session. The SQ session tended to cause a decreased salivary flow rate in the postexercise condition. This effect was significantly recovered in the 1-hr postexercise condition. The VB+SQ session caused a significant decrease in the salivary flow rate in the postexercise condition from 0.40± 0.03 mL/min (baseline) to 0.30±0.02 mL/min, and this effect was recovered to baseline by 1 hr after the completion of the exercise session. Unlike salivary flow rate, any exercise sessions had no effects on salivary pH (Fig. 4B).

Changes in the salivary flow rate and salivary pH after the three exercise programs. (A) Salivary flow rate. (B) Salivary pH. Data are expressed as mean±standard error of the mean, n=20. One-way repeated-measures analysis of variance with Geisser-Greenhouse correction followed by Tukey multiple comparison was used for statistical analysis. VB, whole-body vibration at 25 Hz on platform; SQ, squats on platform; VB+SQ, whole-body vibration at 25 Hz and squats on platform; Pre, pre-exercise condition; Post, postexercise condition; Post 1 hr, 1-hr postexercise condition. *P<0.05.
Changes in HR caused by the three different exercise sessions
The HR was significantly increased compared with the pre-exercise condition after all three exercise sessions. The VB session caused a significant increase in HR in set 2 and subsequently reached a plateau phase. The SQ session increased the HR in set 2 and showed a set-dependent manner. The VB+SQ session caused the highest increase in the HR starting from set 1 and showed a set-dependent manner. The HR recovered to baseline by 1 hr after exercise in all groups (Fig. 5A).

Heart rate (HR), blood pressure (BP), and rate-pressure product (RPP) changes in response to the three different exercise conditions. (A) Changes in HR caused by the three different exercise sessions. (B) Changes in BP caused by the three different exercise sessions. (C) Changes in RPP caused by the three different exercise sessions. Data are expressed as median (interquartile range), n=20. The Friedman test followed by Dunn multiple comparisons was used for comparisons with the respective pre-exercise condition. SBP, systolic blood pressure; MAP, mean arterial pressure; DBP, diastolic blood pressure; VB, whole-body vibration at 25 Hz on platform; SQ, squats on platform; VB+SQ, whole-body vibration at 25 Hz and squats on platform; Pre, pre-exercise condition; Set 1–5, resting period between each set of exercise; Post, postexercise condition; Post 1 hr, 1-hr postexercise condition. *P<0.05. **P<0.01. ***P<0.001. ****P<0.0001.
Changes in the BP and RPP caused by the three different exercise sessions
The SBP was significantly increased from baseline throughout the exercise session in all groups (Fig. 5B). Moreover, the MAP consistently increased from baseline during the VB+SQ session, but not VB or SQ alone. Unlike the SBP, the DBP did not change during the exercise sessions, except during set 1 of the VB+SQ session. The VB+SQ group caused the highest RPP response among the three exercise conditions (Fig. 5C).
Changes in the HR variability during the three different exercise sessions
As shown in Table 2, the VB session significantly decreased the mean RR, SDNN, and RMSSD in the time domain of HRV during the exercise condition. The mean RR and SDNN recovered to baseline values in the postexercise condition. Moreover, the time domain variables were fully recovered in the 1-hr postexercise condition. The normalized unit of low frequency (LF) in postexercise and 1-hr postexercise conditions significantly increased from during the exercise condition to baseline values. Inversely, the normalized unit of high frequency (HF) significantly decreased in postexercise and 1-hr postexercise conditions but not different from baseline condition. A high ratio of LF/HF indicates sympathetic dominance (Shaffer and Ginsberg, 2017); the LF/HF ratio in postexercise and 1-hr postexercise conditions were significantly increased from during the exercise condition but not different from baseline values. The ellipse width in Poincaré plot (SD1) of nonlinear HRV, which is mainly influenced by parasympathetic modulation (Roy and Ghatak, 2013), was significantly decrease during exercise and significantly recovered to the baseline values at 1 hr after exercise. The ellipse width in Poincaré plot (SD2), which reflects sympathetic activity (Roy and Ghatak, 2013), was significantly decreased during the exercise condition and subsequently increased in the postexercise and 1-hr postexercise conditions compared with the SD2 during exercise condition, but was not different from the baseline values. A high SD1/SD2 ratio reflects parasympathetic dominance (Phoemsapthawee et al., 2019); the SD1/SD2 ratio was not changed by the VB session.

HRV response to the three different exercise conditions (n=20)
The SQ session caused alterations in the time domain, frequency domain, and nonlinear HRV (Table 2). The mean RR, RMSSD, and pNN50 in the time domain of HRV were significantly decreased during exercise. Moreover, the SDNN, RMSSD, and pNN50 were significantly decreased in the postexercise condition. All time domain variables were recovered to baseline values in the 1-hr postexercise condition. The normalized unit of LF and the LF/HF ratio tend to increase in postexercise condition from the pre-exercise condition (P=0.06), corresponding to a decrease in the normalized unit of HF (P=0.06). These variables returned to baseline values in the 1-hr postexercise condition. Additionally, the SD1 and SD1/SD2 ratio in nonlinear HRV were significantly decreased during the exercise session, while SD1 and SD2 were significantly decreased in the pos-exercise condition. These variables had recovered to baseline values in the 1-hr postexercise condition.
The VB+SQ session caused more changes in cardiac autonomic modulation compared with the SQ and VB sessions (Table 2). All variables in the time domain were significantly decreased during the exercise session and in the postexercise condition. These variables had recovered to baseline values in the 1-hr postexercise condition. The normalized unit of LF and LF/HF ratio were significantly increased from baseline and during exercise values in post-exercise condition, corresponding to a decrease in the normalized unit of HF. These variables were recovered to baseline values in the 1-hr postexercise condition. Moreover, the SD1 and SD2 in nonlinear HRV were significantly decreased during the exercise session and in the postexercise condition compared with the pre-exercise condition, while the SD1/SD2 ratio was significantly decreased compared with baseline and during the exercise session. The nonlinear HRV variables had returned to baseline values in the 1-hr postexercise condition.
Changes in the salivary biomarkers related to exercise intensity in the three different exercise sessions
As shown in Fig. 6A, only the VB+SQ session significantly increased the salivary total protein concentration in the postexercise condition from 0.56±0.05 mg/mL (baseline) to 0.74±0.06 mg/mL (postexercise condition), and the concentration had recovered to baseline by 1 hr after the exercise session; this suggested that the intensity of the VB+SQ session potentially induced a change in the salivary total protein concentration.
Changes in salivary biomarkers related to exercise intensity, autonomic regulation, and cardiovascular in response to the three exercise programs. (A) Salivary total protein concentration. (B) Salivary alpha-amylase activity. (C) Salivary nitrite concentration. Data are expressed as mean±standard error of the mean, n=20. One-way repeated-measures analysis of variance with Geisser- Greenhouse correction followed by Tukey multiple comparison was used for statistical analysis. VB, whole-body vibration at 25 Hz on platform; SQ, squats on platform; VB+SQ, whole-body vibration at 25 Hz and squats on platform; Pre, pre-exercise condition; Set 1–5, resting period between each set of exercise; Post, postexercise condition; Post 1 hr, 1-hr postexercise condition. *P<0.05.
Similarly, the sAA activity was significantly increased by the VB+SQ session from 33.83±5.56 U/mL (baseline) to 63.63± 12.33 U/mL (postexercise condition), but not by the other two sessions (Fig. 6B). This indicated that sympathetic activity was strongly activated by the VB+SQ session.
The salivary NO production determined by the salivary nitrite concentration was not changed during any of the three exercise conditions (Fig. 6C). This suggested that a single session of vibration alone or in combination with squat exercises did not alter salivary NO production.
DISCUSSION
WBVEs have various beneficial effects on health outcomes incorporated with physiological and biochemical responses and adaptations (Cardinale and Wakeling, 2005). The present study examines both cardiovascular response and the changes in salivary biomarkers related to exercise intensity to three exercise programs (VB, SQ, and VB+SQ) performed by healthy adults.
According to previous studies, the salivary flow rate responses to exercise vary depending on the exercise program (Ligtenberg et al., 2016; Reid et al., 2001; Souza et al., 2019). Previous study has been reported that aerobic exercise achieved by cycling on cycle-ergometers for 15 min at a target HR of 130–140 bpm results in no changes in the salivary flow rate and salivary pH in physically active adults (Ligtenberg et al., 2016). Similarly, resistance exercise using the 12-repetition maximum method to perform Smith machine SQ, leg presses, lying leg curls, and stiff exercises for three sets with 2-min rest intervals between sets and exercises causes no change in the salivary flow rate of trained healthy males (Souza et al., 2019). In contrast, aerobic exercises achieved by performing high-intensity interval exercise at 100% wVO2max for 1 min of cycling and at 40% for 1 min of passive recovery until exhaustion on a cycle-ergometer increases the salivary flow rate in the 3 hr postexercise period (Souza et al., 2019). Similarly, continuous exercise comprising continuous cycling for 60 min at 50%–60% of wVO2max also increases the salivary flow rate in the 3-hr postexercise period (Souza et al., 2019). A study of healthy adults performing mild to moderate aerobic exercise using a cycle-ergometer showed that the salivary flow rate decreases in the postexercise period and then recovers to baseline values at 30 min after exercise (Reid et al., 2001). Physiologically, the salivary secretion is partly regulated by autonomic nervous system including sympathetic and parasympathetic functions (Pedersen et al., 2018). Sympathetic nervous system decreases volume of salivary secretion. In the present study, we hypothesized that sympathetic nervous system is strongly activated in the VB+SQ session and subsequently causes inhibition of salivary flow rate. Unlike salivary flow rate, all exercise groups including VB, SQ, and VB+SQ sessions in our present study have no effect on salivary pH. It is possible that a single session of these exercises does not alter the salivary buffer system, such as bicarbonate, phosphate, and protein buffers.
It is well known that the HR is regulated by sympathetic and parasympathetic functions. Six minutes of passive vibration at 25 Hz has been reported to increase the HR during the exercise period in normotensive women with and without obesity (Dipla et al., 2016). According to previous study, 200 repetitions of body weight SQ increase the HR in a time-dependent manner in young men (Haramura et al., 2017). Our findings suggested that the VB session evoked a minimal HR response, whereas the SQ program caused a greater stimulation of the HR that was dependent on the number of sets performed during the exercise session. Moreover, the VB+SQ program caused a synergistic effect on the increase in HR during exercise in a set-dependent manner.
The maintenance of SBP and MAP at higher levels during exercise in VB+SQ session compared with VB or SQ alone is considered. The VB+SQ session is more likely to cause greater changes in BP regulation. It is maybe due to (1) whole-body vibration activates muscles contraction through the tonic-vibration reflex (Wang et al., 2022); (2) dynamic SQ can recruit multiple large muscle groups (Yavuz et al., 2015); (3) combination of VB and SQ resulting in higher targeted muscle contraction possibly accompanied by higher O2 demand and cardiac output (Hanson et al., 1995; Rittweger et al., 2001); (4) VB+SQ sessions lead to a notable increase in sympathetic and a decrease in parasympathetic outflow during exercise. Moreover, SBP and MAP responses to the last three sets of VB+SQ are not increased in set-dependent manner which may be influenced by partial recovery of arterial baroreflex in resting period between each set to maximal intensity during exercise. The precise mechanisms are not investigated in our present study. Previous research has shown that whole-body vibration with resistance exercise causes a hypotensive effect at about 30 min to 1.15 hr after exercise in prehypertensive adults (Zeigler and Swan, 2016). However, this effect was not observed in normotensive healthy adults after any of the exercise sessions performed in our present study. This may be due to differences in subject conditions, the exercise type, exercise intensity, vibration frequency, exercise duration, and duration of the rest period between sets of exercise. Besides the HR and BP, our findings suggested that the VB+SQ session promoted more RPP response, a noninvasive indicator of myocardial oxygen consumption (Ansari et al., 2012; Gobel et al., 1978), than the VB or SQ alone.
Cardiac autonomic function plays a pivotal role in the regulation of the cardiovascular response during exercise (Wong and Figueroa, 2019). An acute HRV response to whole-body vibration has been previously observed (Wong and Figueroa, 2019). For instance, passive whole-body vibration increases sympathetic modulation depending on the vibration frequency in healthy drivers (Jiao et al., 2004), and suppresses parasympathetic activity during exercise in normotensive women with and without obesity (Dipla et al., 2016). Furthermore, whole-body vibration induces changes in the time domain but not the frequency domain of HRV in older adults (Licurci et al., 2018). In the present study, the VB+SQ session caused the largest magnitude regulation of sympathetic and parasympathetic outflow, while the VB or SQ alone has partial effects on the overall cardiac autonomic function. This suggests that the application of acute stress of exercise to the cardiac autonomic function is dependent on the exercise condition.
Exercise alters the salivary composition, including salivary biomarkers (Ntovas et al., 2022). The total protein concentration, sAA activity, and NO production are increased by resistance exercise, high-intensity interval exercise, and continuous exercise (Souza et al., 2019). In the present study, only the exercise intensity in the VB+SQ session has the potential to modulate salivary biomarkers related to exercise intensity including the total protein concentration, a biomarker of exercise intensity, and sAA activity, a biomarker of sympathetic outflow during exercise corresponded to the HRV variables. However, all three programs did not influence the salivary NO level. A previous study found that NO production in whole blood was not affected by whole-body vibration, even though skin blood flow increased (Johnson et al., 2014). They suggested that the increase in skin blood flow may be due to local NO production or other chemical responses, such as histamine production. However, in the current study has some limitations, the systemic NO production was not examined.
Our findings suggest that dynamic SQ have synergistic effects with whole-body vibration on physiological responses. This combination provides sufficient intensity to modulate both the cardiovascular system and salivary biomarkers related to exercise intensity. This makes it suitable for designing exercise programs that incorporate VB+SQ to enhance hemodynamic and cardiac autonomic function in healthy adults and for application during rehabilitation periods, such as in individuals recovering from post coronavirus disease 2019 infection, which requires further study.
ACKNOWLEDGMENTS
This research was funded by Chulabhorn Royal Academy, grant number RAA2565/030 and the Research Group in Exercise and Aging-Associated Diseases, Faculty of Medicine, Thammasat University, Thailand.
We thank Kelly Zammit, BVSc, from Edanz ( https://jp.edanz.com/ac) for editing a draft of this manuscript.
Notes
CONFLICT OF INTEREST
No potential conflict of interest relevant to this article was reported.